Contractor Job Costing Spreadsheet: Track Profit Per Job
You finished a $10,000 kitchen. It went well. The customer paid, the check cleared, and you feel like you had a good month.
Here is the uncomfortable question: did that job make more money than the $2,700 fence repair you knocked out in four days?
Full walkthrough of the template used in this guide.
Most contractors cannot answer it. Not because they are careless — because the information is scattered. The quote is in an email. The material receipts are in the truck. The hours are in your head or on a text thread with your helper. Your bank balance tells you what happened across everything at once, which is precisely the thing you did not need to know.
Job costing fixes that. It is not accounting, and it is not complicated. It is assigning every dollar and every hour to the job that caused it, so that when a job closes you get one number: what it actually made you.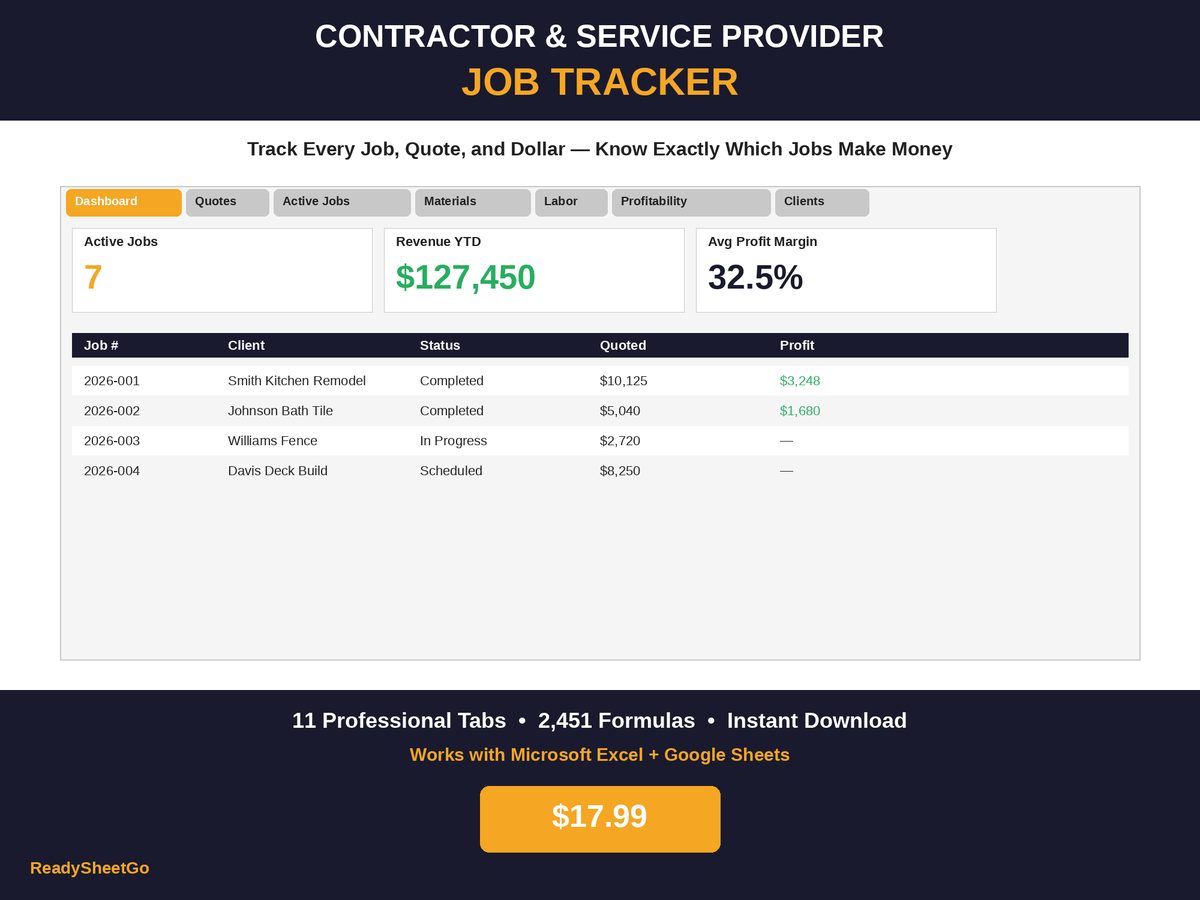
This guide walks the full method with three real jobs costed end to end. Every assumption is labelled so you can swap in your own rates.
The Five Numbers That Make Up a Job
A costed job has five layers, and the order matters:
- Quoted price — what you told the customer, from your materials estimate, labor estimate and markup.
- Change orders — approved additions during the job. Quoted price plus change orders is your final price, and final price is what you compare everything against. Not the original quote.
- Actual material cost — every receipt tagged to this job.
- Actual labor cost — every hour worked on this job, at each person’s real rate.
- Overhead allocation — your truck, insurance, phone, tools, software and unbilled time, charged to the job as a share of price.
Final price minus materials minus labor is gross profit. Gross profit minus overhead is net profit — the only one of these figures that is actually yours.
The overhead step is where most contractors’ mental math falls apart. If you skip it, every job looks profitable, because your overhead is real whether or not you assign it to anything. The convention used throughout this guide is 15% of final price, which is a reasonable middle for a one-truck operation. Yours might be 10%, or 22%. Work it out once: total annual overhead divided by total annual revenue.
Three Jobs, Costed
Here are the assumptions in force for every job below. Change them to yours and the method still works.
| Assumption | Value |
|---|---|
| Owner’s labor rate (charged to jobs) | $65.00/hr |
| Helper’s labor rate | $25.00/hr |
| Overhead allocation | 15% of final price |
Job 2026-001 — Kitchen remodel
The quote. Materials estimated at $4,500, labor estimated at $3,200, quoted at a 25% markup:
($4,500 + $3,200) × 1.25 = $9,625
The change order. Two weeks in, the customer asked for under-cabinet lighting. Priced at $500 and approved. Final price becomes $10,125.
What materials actually cost.
| Item | Supplier | Actual |
|---|---|---|
| Cabinets — 12 units | Home Depot | $2,200 |
| Granite countertops, installed | Stone World | $1,850 |
| Backsplash tile — subway 3×6 | Floor & Decor | $230 |
| Cabinet hardware — pulls | Amazon | $148 |
| Total materials | $4,428 |
Estimated $4,500, actual $4,428 — $72 under. Materials were fine.
What labor actually cost.
| Day | Owner hrs | Helper hrs |
|---|---|---|
| Demo | 8 | 8 |
| Cabinet install, day 1 | 10 | 10 |
| Cabinet install, day 2 | 10 | 10 |
| Counters & tile | 9 | 9 |
| Finish & punch list | 6 | 4 |
| Total | 43 | 41 |
Owner: 43 × $65 = $2,795 Helper: 41 × $25 = $1,025 Total labor: $3,820
Estimated $3,200, actual $3,820 — $620 over. There is the leak, and it is invisible unless somebody logs hours by job.
The result.
| Line | Amount |
|---|---|
| Final price | $10,125.00 |
| − Materials | $4,428.00 |
| − Labor | $3,820.00 |
| Gross profit | $1,877.00 |
| − Overhead (15% of $10,125) | $1,518.75 |
| Net profit | $358.25 |
| Margin | 3.5% |
Five weeks of work by two people on a ten-thousand-dollar job, and it cleared $358.
Job 2026-002 — Master bathroom tile
Materials estimated $1,800, labor estimated $2,400, quoted at 20% markup: ($1,800 + $2,400) × 1.20 = $5,040. No change orders, so final price is also $5,040.
Actual materials came in at $1,742. Labor: 22 owner hours ($1,430) and 14 helper hours ($350) — $1,780 against a $2,400 estimate, comfortably under.
| Line | Amount |
|---|---|
| Final price | $5,040.00 |
| − Materials | $1,742.00 |
| − Labor | $1,780.00 |
| Gross profit | $1,518.00 |
| − Overhead (15%) | $756.00 |
| Net profit | $762.00 |
| Margin | 15.1% |
Half the revenue of the kitchen. Twice the profit.
Job 2026-003 — Fence repair, 80ft cedar
Storm damage, quoted fast. Materials $1,200, labor $900, 20% markup: ($1,200 + $900) × 1.20 = $2,520. A $200 change order for an extra section and gate hardware takes final price to $2,720.
Actual materials $1,164. Labor: 11 owner hours ($715) plus 8 helper hours ($200) = $915.
| Line | Amount |
|---|---|
| Final price | $2,720.00 |
| − Materials | $1,164.00 |
| − Labor | $915.00 |
| Gross profit | $641.00 |
| − Overhead (15%) | $408.00 |
| Net profit | $233.00 |
| Margin | 8.6% |
What the three jobs say together
| Job | Final price | Net profit | Margin |
|---|---|---|---|
| Kitchen remodel | $10,125 | $358.25 | 3.5% |
| Bathroom tile | $5,040 | $762.00 | 15.1% |
| Fence repair | $2,720 | $233.00 | 8.6% |
| Total | $17,885 | $1,353.25 | 7.6% |
Rank them by revenue: kitchen, bathroom, fence. Rank them by profit: bathroom, kitchen, fence. Rank them by margin: bathroom, fence, kitchen — the biggest job is now last.
Nothing in your bank statement contains this. It shows $17,885 arriving and a lot of it leaving. The job-level view says something you can act on: bathrooms are your good work, and your kitchen labor estimating is broken by about 20%.
That is one month of data. Six months of it will tell you what to bid on, what to walk away from, and which of your estimates to pad.
The Sheets That Produce This
You need five linked tables and a job number that appears in all of them. The job number is the whole trick — it is what lets a receipt entered on Tuesday find its way into the right profit line.
1. Quotes & Estimates
Every quote you send, with materials estimate, labor estimate, markup % and the computed total. Status moves Pending → Accepted → Declined, with a follow-up date and, on acceptance, the job number it became.
Two things fall out of this table for free: your quote win rate, and — by comparing the estimate columns here against the actuals later — proof of whether you estimate labor or materials worse. In the kitchen job above, it was labor, and it was not close. How many quotes you need to send to land a job, and why a 90% win rate is a bad sign.
2. Active Jobs
One row per job: job number, client, address, scope, start date, estimated and actual completion, status, quoted price, change orders, and payment status. Final price is quoted price plus change orders, calculated, not typed.
Payment status is the column that pays for the spreadsheet on its own. Sum the jobs where status isn’t “Paid” and you have your outstanding receivables — the number contractors most often carry around as a vague feeling.
3. Materials — with an estimated column and an actual column
Every purchase, tagged with the job number, with quantity, unit cost, estimated total, actual total and the variance between them.
The variance column is not bookkeeping. It is an early warning. If you are three purchases into a job and already $400 over on materials, you want to know on day four, not at final invoice. Log receipts the day you get them and the variance updates itself.
4. Labor Log
Job number, worker, date, hours, rate, total. One row per person per day. This is the tab people resist and the tab that produces the finding — the kitchen’s $620 labor overrun does not exist anywhere else.
It also becomes your payroll record and your evidence when a customer asks why a job took what it took. And if you are paying a helper $25 an hour, note that $25 is not what that hour costs you. The real cost of an employee hour, worked through with burden and non-billable time.
5. Job Profitability
The report. It pulls final price from Active Jobs, material cost from Materials, labor cost from the Labor Log — all by job number — and returns gross profit, the overhead allocation, net profit and margin % on every row. Nothing is typed here. If the job number is consistent, the report writes itself.
Sort it by margin and you have a list of what to sell more of.
Plus two that quietly matter
Client database. Name, phone, address, property type, how they found you, and — calculated — how many jobs they have given you and their total revenue. Referral source is the field to actually fill in: after twenty jobs it tells you which lead channel is worth money and which is worth nothing.
Warranty and callback tracker. Completion date plus warranty period gives a warranty expiry date, and a callback log records what came back and how it was resolved. Callbacks are unpriced labor — they hit the profit of a job you already closed. Tracking them is how you find out that a particular material, or a particular sub, is costing you.
Where the Money Actually Leaks
Across a costed year, the same four leaks show up.
Markup that is not what you think it is. A 25% markup is not a 25% profit. On the kitchen quote it produced a 20% gross margin, and after 15% overhead, a 5% net. Most contractors quote a markup and mentally bank a margin. The conversion table, and the minimum markup below which you are working for free.
Change orders priced by feel. “Sure, about five hundred” is how a job that was going fine ends up subsidising the customer. The lighting change order above cost $542 to deliver and was sold for $500. How to price and log a change order so it improves the job instead of diluting it.
Labor estimated from memory. The only cure is a labor log and the discipline of comparing it back to the estimate. Two or three jobs of that and your estimating gets measurably better, because you finally have a record of how long things take you, not how long they take in general.
Overhead nobody allocates. Insurance, truck payment, fuel, phone, tools, licensing, software, and every hour spent quoting work you did not win. It is real. Charge it to jobs or it comes out of your profit invisibly.
How to Start Without a Year of History
You do not need to reconstruct anything.
- Set your two rates and your overhead percentage. Owner rate, helper rate, and total annual overhead ÷ total annual revenue. Fifteen minutes.
- Give your next job a number and use it on every receipt, every logged hour and every line.
- Log materials the day you buy them and hours the day they are worked. Not weekly. The whole system depends on this one habit, and it is about ninety seconds a day.
- Cost the job the day it closes. One job’s numbers will already surprise you.
- After five jobs, sort by margin. That list is your business strategy.
The point of job costing is not tidiness. It is that after a few months you stop guessing which work to chase — and you start turning down the jobs that were quietly costing you money to do.
Featured on ReadySheetGo
Contractor & Service Provider Job Tracker — $17.99
Eleven tabs, built exactly as above, linked by job number.
Quotes & Estimates takes your materials estimate, labor estimate and markup % and returns the quote total, then tracks Pending → Accepted → Declined with a follow-up date — your win rate calculates itself. Active Jobs holds job number, client, address, scope, dates, quoted price, change orders and payment status, and pulls material cost and total labor in automatically by job number while final price adds change orders for you. Materials logs every purchase per job with estimated total, actual total and the variance between them, so overruns surface mid-job. A 500-row Labor Log records every hour by worker and rate. Job Profitability turns all of it into gross profit, a 15% overhead allocation, net profit and margin % on every job.
Then: a Client Database that counts each client’s jobs and totals their lifetime revenue automatically with referral source and rating; a Warranty & Callback Tracker that calculates warranty expiry from completion date and logs callbacks; a Revenue Tracker comparing month-by-month revenue across three years so your busy and slow seasons are visible; an Equipment Log for vehicle and tool maintenance with next-service-due dates; and a Dashboard returning active jobs, open quotes, revenue MTD and YTD, average job profit, quote win rate, outstanding payments, jobs completed this month, average job value and total clients.
Sample data is pre-filled so you can see it working — type over it with your own. Works in Excel and Google Sheets.
Get the Contractor & Service Provider Job Tracker →
Frequently Asked Questions
What is job costing for a contractor?
Job costing is assigning every dollar of material, every hour of labor and a share of your overhead to the specific job that caused it, then comparing that total against what the customer actually paid. The output is net profit and margin per job rather than one lump number for the business. It matters because contracting jobs vary enormously in profitability, and a business-level P&L averages that variation away — which is exactly the information you needed.
How do you calculate profit on a contracting job?
Final price (quoted price plus approved change orders) minus actual material cost minus actual labor cost gives gross profit. Then subtract an overhead allocation — a common convention is 15% of the final price — to get net profit. Divide net profit by final price for margin. In the worked kitchen job in this guide the numbers are $10,125 − $4,428 − $3,820 = $1,877 gross, minus $1,518.75 overhead, leaving $358.25 net, or a 3.5% margin.
Why do my biggest jobs make the least money?
Because big jobs carry more places to lose money and are usually quoted at a lower markup to win them. The three worked jobs in this guide make the point: the $10,125 kitchen netted $358.25, the $5,040 bathroom netted $762, and the $2,720 fence repair netted $233. Revenue rank and profit rank are completely different orders. You cannot see this without costing each job individually.
Do contractors need job costing software or is a spreadsheet enough?
For a solo contractor or a small crew, a spreadsheet does it — you need a quote log, a job tracker, per-job material and labor logs, and a profitability report that links them by job number. Dedicated construction software earns its subscription when you are running payroll for several crews, managing progress draws across many concurrent jobs, or need field staff entering time from phones. Plenty of contractors run a spreadsheet for years and hand a summary to their accountant annually.