Contractor Markup vs Margin: What to Charge on a Job
You quoted a kitchen at a 25% markup. The job closed clean, no drama, materials on estimate.
You made 3.5%.
Full walkthrough of the template used in this guide.
This is not a story about a bad job. It is a story about two words that sound like they mean the same thing and do not, and about what happens when you quote using one and think using the other.
The Two Words
Markup is measured against your cost. You take what the job costs you and add a percentage.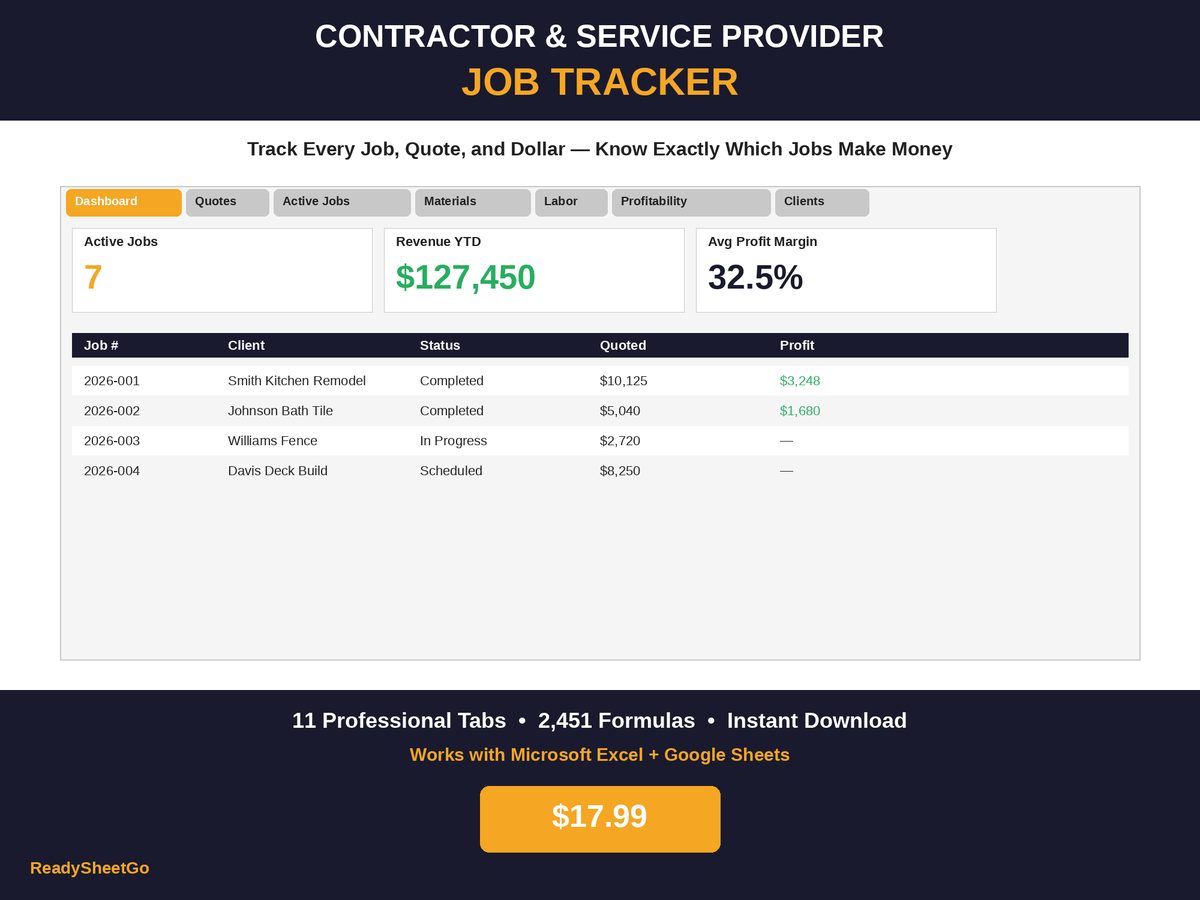
Margin is measured against the price. It is what fraction of the customer’s money you kept.
Take the kitchen quote from the job costing guide: $4,500 of materials plus $3,200 of labor is $7,700 of cost. At a 25% markup:
$7,700 × 1.25 = $9,625
Gross profit is $9,625 − $7,700 = $1,925.
Now measure that $1,925 two ways:
- Against cost: $1,925 ÷ $7,700 = 25% ← the markup
- Against price: $1,925 ÷ $9,625 = 20% ← the margin
Same job. Same dollars. Two different percentages, and only one of them is the share of the customer’s cheque you actually kept.
The Conversion Table
The relationship is fixed:
margin = markup ÷ (1 + markup)
| Markup | Gross margin |
|---|---|
| 10% | 9.1% |
| 15% | 13.0% |
| 20% | 16.7% |
| 25% | 20.0% |
| 30% | 23.1% |
| 35% | 25.9% |
| 40% | 28.6% |
| 50% | 33.3% |
| 66.7% | 40.0% |
| 100% | 50.0% |
Note how the gap widens. At 10% markup you lose about a point in translation. At 50% markup you lose nearly seventeen. The bigger your markup, the more it flatters you.
And going the other way — markup = margin ÷ (1 − margin) — is the direction you actually need, because margin is what you should be deciding first:
| Gross margin you want | Markup you must quote |
|---|---|
| 15% | 17.6% |
| 20% | 25.0% |
| 25% | 33.3% |
| 30% | 42.9% |
| 35% | 53.8% |
| 40% | 66.7% |
Anyone telling you to “add 30%” has not said which one they mean, and the two answers are $10,010 and $11,000 on the same $7,700 job.
Then Overhead Takes Its Cut
Gross margin is still not your profit. It is what is left before your truck payment, insurance, phone, licensing, tools, software, and every hour you spent quoting jobs you did not get.
Charge overhead to the job at 15% of price — the convention used across this cluster — and the kitchen quote finishes like this:
| Line | Amount |
|---|---|
| Price (25% markup on $7,700) | $9,625.00 |
| − Cost (materials + labor) | $7,700.00 |
| Gross profit | $1,925.00 (20.0%) |
| − Overhead (15% of $9,625) | $1,443.75 |
| Net profit | $481.25 |
| Net margin | 5.0% |
A 25% markup, quoted confidently, delivering a 5% net margin on a job where nothing went wrong.
And on the real version of that job — where labor ran $620 over and a $500 change order was priced at cost — the net came out at $358.25, or 3.5%.
The Number That Should Change How You Quote
Set net profit to zero and solve. With overhead at 15% of price, you break even when gross margin equals 15%, which means:
17.6% markup is your break-even. Below it, the job loses money.
Every point of markup above 17.6% is real. Below it, you are running a very busy charity.
Here is the same overhead assumption applied across the range:
| Markup | Gross margin | Net margin after 15% overhead |
|---|---|---|
| 15% | 13.0% | −2.0% |
| 17.6% | 15.0% | 0.0% |
| 20% | 16.7% | 1.7% |
| 25% | 20.0% | 5.0% |
| 30% | 23.1% | 8.1% |
| 33.3% | 25.0% | 10.0% |
| 40% | 28.6% | 13.6% |
| 42.9% | 30.0% | 15.0% |
| 50% | 33.3% | 18.3% |
Read that table once and the strategy is obvious. A 20% markup earns you $17 per $1,000 of work. A 40% markup earns $136. The difference between a business that survives and one that grows is roughly fifteen points of markup, and it is entirely a decision you make before the job starts.
Working Out Your Own Overhead Rate
The 15% above is a placeholder. Yours is calculable and you should do it once a year.
Add up everything that is not job materials and not job labor:
| Overhead item | Annual (example) |
|---|---|
| Truck payment, fuel, maintenance, insurance | $11,400 |
| General liability + tools insurance | $3,600 |
| Phone, internet, software, bookkeeping | $2,400 |
| Licensing, permits, dues, training | $1,200 |
| Tool purchase and replacement | $2,800 |
| Unbilled admin and estimating time | $4,600 |
| Total overhead | $26,000 |
Divide by annual revenue. On $175,000 of revenue that is 14.9% — near enough to 15% that the convention holds. On $110,000 of revenue the same overhead is 23.6%, and every one of the tables above shifts against you. A smaller contractor needs a higher markup than a bigger one to reach the same net, which is the opposite of what price competition pushes you to do.
A Quick Self-Check
Take the last job you finished.
- Add your actual materials and actual labor. That is cost.
- Divide the final price by that cost, subtract 1. That is the markup you actually achieved — not the one you quoted, because overruns and underpriced change orders eat into it.
- Convert it to margin with the first table.
- Subtract your overhead rate.
If step 4 is negative, that job cost you money to complete, and it will keep happening until the markup changes. If you quoted 25% and step 2 comes out at 18%, the leak is not your pricing — it is your estimating or your change orders, and those are separately fixable.
The reason to keep this in a spreadsheet rather than doing it on the back of an invoice is that one job tells you almost nothing and twenty jobs tell you everything. When quoted markup, achieved markup and net margin sit in columns next to each other across every job you have done, the pattern in your pricing stops being an opinion.
Featured on ReadySheetGo
Contractor & Service Provider Job Tracker — $17.99
The Quotes & Estimates tab is where this math lives: enter a materials estimate, a labor estimate and a markup %, and it returns the quote total — so testing 25% against 40% on a real job takes one keystroke. Quotes track Pending → Accepted → Declined with a follow-up date and the job number they became.
The Job Profitability tab then closes the loop. It pulls final price, actual material cost and actual labor cost by job number and returns gross profit, a 15% overhead allocation, net profit and margin % on every job — so the markup you quoted and the margin you actually achieved sit side by side. Sort by margin and your pricing pattern is right there.
Eleven tabs in total, including Active Jobs, a per-job Materials log with an estimated-vs-actual variance column, a 500-row Labor Log, Client Database, Warranty & Callback Tracker, three-year Revenue Tracker, Equipment Log and a Dashboard with average job profit, quote win rate and outstanding payments. Sample data pre-filled. Works in Excel and Google Sheets.
Get the Contractor & Service Provider Job Tracker →
Frequently Asked Questions
What is the difference between markup and margin for a contractor?
Markup is measured against your cost; margin is measured against the price the customer pays. A 25% markup on $7,700 of cost gives a $9,625 price and $1,925 of gross profit — which is 20% of the price, not 25%. The formula is margin = markup ÷ (1 + markup). Markup is always the bigger-sounding number, which is why quoting in markup and thinking in margin loses contractors money.
What markup should a contractor charge?
Work backwards from the net margin you want and your overhead rate rather than copying an industry figure. With overhead at 15% of price, a 33.3% markup produces a 25% gross margin and about a 10% net margin; a 42.9% markup produces a 30% gross margin and about 15% net. Below roughly 17.6% markup, a job with 15% overhead makes nothing at all.
Is a 20% markup enough for a contractor?
Usually not. A 20% markup is a 16.7% gross margin, so with overhead at 15% of price you are left with about 1.7% net — roughly $17 on a $1,000 job, with no room for a labor overrun or an underpriced change order. It is a rate that only works if your overhead is genuinely low and your estimates are consistently accurate.
Should I mark up materials and labor at the same rate?
Many contractors use one blended markup across both, which is simplest and is what the worked examples here assume. Some apply a higher markup to labor because labor carries more risk of overrunning, and a lower one to materials on jobs with an unusually large material component so the quote stays competitive. Either is defensible — what matters is that whatever rate you pick clears overhead with margin to spare.