Contractor Quote Win Rate: How Many Bids to Land a Job
“I quote a lot of work.”
Ask a contractor how many quotes they sent last month and you get a shrug and a range. Ask what fraction turned into jobs and you get a story about one that got away.
Full walkthrough of the template used in this guide.
Which is a shame, because this is one of the few numbers in a contracting business you can compute in ten seconds and then plan an entire year around.
Two Win Rates, Two Questions
Here are five quotes from one quarter: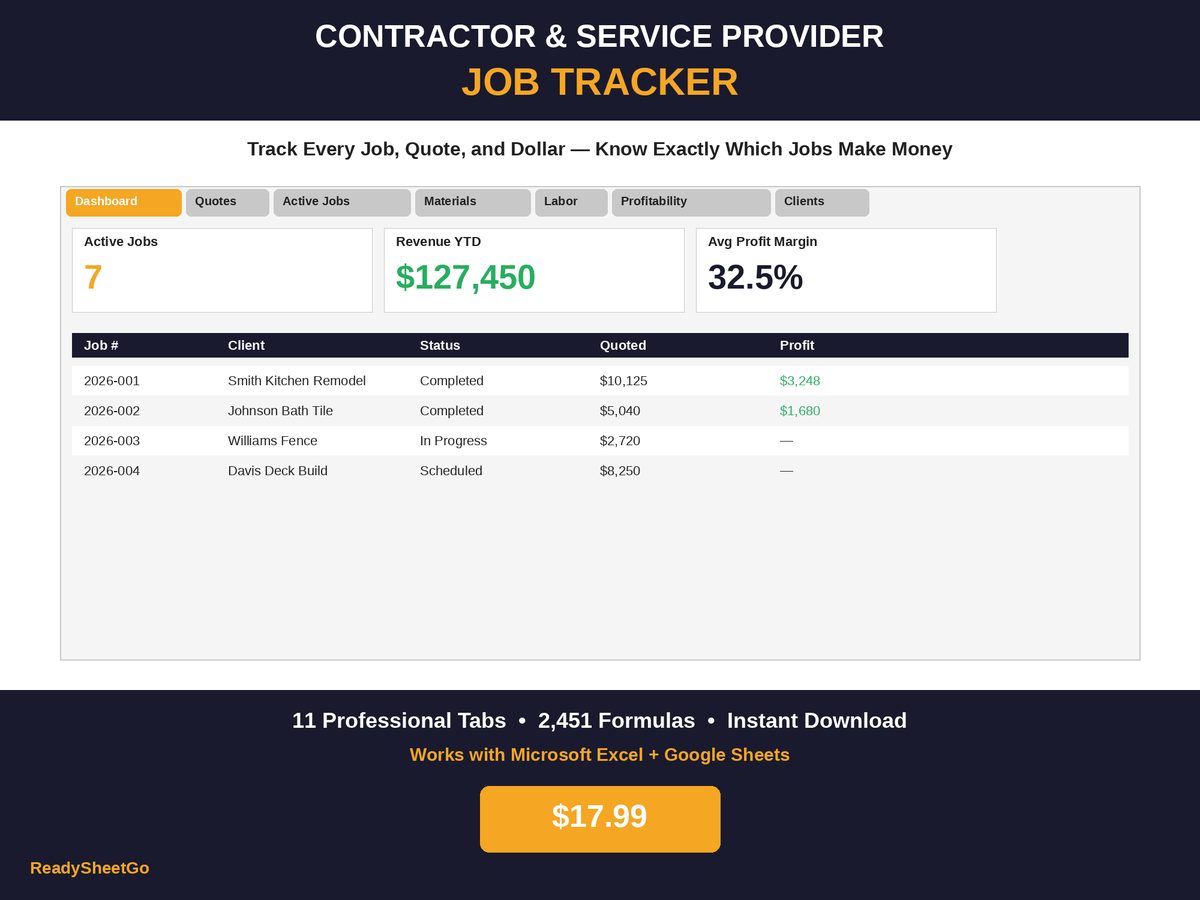
| Quote # | Client | Job | Total | Status |
|---|---|---|---|---|
| Q-2026-001 | J. Smith | Kitchen remodel | $9,625 | Accepted |
| Q-2026-002 | S. Johnson | Bathroom tile | $5,040 | Accepted |
| Q-2026-003 | M. Davis | Deck build, 12×16 composite | $8,250 | Pending |
| Q-2026-004 | L. Chen | Interior painting, 4 rooms | $2,860 | Declined |
| Q-2026-005 | T. Williams | Fence repair, 80ft cedar | $2,520 | Accepted |
Win rate on decided quotes = 3 ÷ 4 = 75%. This is the pricing and pitch number. It ignores the pending one because the customer has not answered, and it tells you how you do when someone actually chooses.
Win rate on all quotes sent = 3 ÷ 5 = 60%. This is the planning number. It treats pending as a loss, because for forecasting purposes a quote nobody has accepted is not revenue.
Use 75% to judge your pricing. Use 60% to plan your workload — planning off the flattering number is how contractors end up with an empty April.
How Many Quotes a Revenue Target Needs
Average accepted job value from the three wins:
($9,625 + $5,040 + $2,520) ÷ 3 = $5,728.33
Note it is accepted job value, not average quote value. The declined painting job at $2,860 and the pending deck at $8,250 both tell you something, but neither is money.
Now, for a $12,000 revenue month:
Jobs needed: $12,000 ÷ $5,728.33 = 2.1 jobs Quotes needed: 2.1 ÷ 0.60 = 3.5 quotes
Three and a half quotes a month. That is the whole marketing plan, and it is a completely different feeling from “I should probably drum up some work.”
Run it across win rates and the leverage becomes obvious:
| Win rate (all sent) | Quotes needed for $12,000 |
|---|---|
| 30% | 7.0 |
| 40% | 5.2 |
| 50% | 4.2 |
| 60% | 3.5 |
| 70% | 3.0 |
| 80% | 2.6 |
And across revenue targets at a 60% win rate:
| Monthly revenue target | Jobs needed | Quotes to send |
|---|---|---|
| $8,000 | 1.4 | 2.3 |
| $12,000 | 2.1 | 3.5 |
| $18,000 | 3.1 | 5.2 |
| $25,000 | 4.4 | 7.3 |
Doubling revenue means roughly doubling quotes — or raising the average job value, which is usually the easier lever and the one most contractors ignore. Moving your average accepted job from $5,728 to $7,500 hits $18,000 on 4.0 quotes instead of 5.2.
Why 90% Is a Problem, Not a Trophy
If you are winning nearly every quote you send, the most likely explanation is not that you are exceptionally persuasive. It is that you are the cheapest bid on the table.
Look at what a high win rate implies. Every homeowner is collecting two or three quotes. If you win almost all of them, you are the low number almost every time — and the low number was low because of the markup you chose. You are converting brilliantly into work that barely pays.
The declined quote in the table above is the healthy one. The painting job was quoted at a 30% markup and lost to someone cheaper. That is exactly what you would expect to happen sometimes if you are pricing near the top of what your market will bear.
A 45% win rate at 15% net margins beats a 90% win rate at 3%. Run it: at 45%, four quotes a month wins 1.8 jobs; at $5,728 average that is $10,310 of revenue and $1,547 of net profit. At 90%, four quotes wins 3.6 jobs — $20,622 of revenue, twice the work, $619 of net profit. Less than half the money for double the days on site.
If you have never lost a quote on price, raise your markup on the next three and watch what happens. Losing one of them is information worth more than the job.
The connection between win rate and margin runs both ways, which is why they belong in the same system — markup versus margin sets out what each rate actually leaves you.
The Pending Column Is Where Money Dies
Q-2026-003 — the $8,250 deck — is sitting in Pending. It was sent on the 10th with a follow-up date of the 17th.
If nobody looks at that date, here is what happens: the customer, who was ready to decide when they called you, collects two more quotes over the following fortnight. By the time you remember, someone else has started. The quote does not get declined — it just never gets answered, which feels less like losing and costs exactly the same.
The fix is unglamorous. Set a follow-up date when you send the quote, about a week out, and put it in a column you actually look at. One dated, friendly follow-up — “just checking whether you had any questions on the deck quote” — recovers a meaningful share of quotes that would otherwise dissolve.
That $8,250 is 69% of a $12,000 month, riding on whether anyone remembers to send one message.
The Four Columns That Do All of This
A quote log needs the totals and the status, obviously. These four are the ones that turn it from a record into a tool:
Status (Pending / Accepted / Declined). Both win rates come from this single column. Without it you have a list of prices.
Follow-up date. Converts intention into a task. This column pays for the whole spreadsheet.
Reason, when declined. One phrase. Too expensive. Went with a relative. Postponed to next year. Never replied. After twenty quotes this is your most valuable business intelligence — because “too expensive” nine times out of ten is a pricing signal, and “postponed” nine times out of ten is a timing signal, and they point in opposite directions.
Lead source. Referral, Google, Nextdoor, sign on the truck. Cross this against status and you learn not just which channel brings the most enquiries but which brings the ones that convert — often not the same channel. A source that sends you ten tyre-kickers is worse than one that sends you two serious buyers.
Where This Meets Job Costing
Win rate on its own can mislead you into chasing volume. Paired with per-job profitability, it stops.
The metric worth optimising is not quotes won — it is profit per quote sent. Take net profit across accepted jobs and divide by the total number of quotes you sent to get them. That number goes up when you win more, and it also goes up when you price better and win less. It is the only one of these figures that cannot be gamed by dropping your prices.
In the worked job costing example, three accepted jobs returned $1,353.25 of net profit from five quotes sent — $270.65 of profit per quote. That is the baseline. Raise your markup and win one fewer job, and if the figure goes up, the higher price was correct.
Featured on ReadySheetGo
Contractor & Service Provider Job Tracker — $17.99
The Quotes & Estimates tab is built for exactly this. Enter a materials estimate, a labor estimate and a markup % and it returns the quote total. Then track each quote Pending → Accepted → Declined with a follow-up date, a notes column for the reason it was lost, and the job number it became on acceptance. Your quote win rate calculates itself and appears on the Dashboard alongside open quotes, average job value, average job profit and outstanding payments.
Accepted quotes carry through by job number into Active Jobs and then into Job Profitability, which returns gross profit, a 15% overhead allocation, net profit and margin % per job — so profit per quote sent is a figure you can actually read rather than reconstruct. The Client Database records how each client found you, so lead source and conversion sit side by side.
Eleven tabs in total, including a per-job Materials log with estimated-vs-actual variance, a 500-row Labor Log, a Warranty & Callback Tracker, a three-year Revenue Tracker and an Equipment Log. Sample data pre-filled. Works in Excel and Google Sheets.
Get the Contractor & Service Provider Job Tracker →
Frequently Asked Questions
How do you calculate a contractor's quote win rate?
Two ways, and they answer different questions. Win rate on decided quotes is accepted ÷ (accepted + declined) — that measures your pricing and your pitch. Win rate on all quotes sent is accepted ÷ total sent, counting anything still pending as a loss — that measures the pipeline you can plan revenue with. In the worked example, five quotes with three accepted, one declined and one pending give 75% on decided quotes and 60% on all sent.
How many quotes does a contractor need to send to hit a revenue target?
Divide your monthly revenue target by your average accepted job value to get jobs needed, then divide that by your win rate. For a $12,000 target with a $5,728 average accepted job and a 60% win rate: $12,000 ÷ $5,728 = 2.1 jobs, and 2.1 ÷ 0.60 = about 3.5 quotes a month. At a 40% win rate the same target needs 5.2 quotes.
Is a high quote win rate good for a contractor?
Not necessarily. A win rate above roughly 80% usually means you are the cheapest bidder rather than the best one, and every job you win at that price carries the low margin that won it. Losing some quotes on price is evidence you are testing the top of the market. What matters is profit per quote sent, not the percentage — a 45% win rate at healthy margins beats a 90% win rate at break-even.
When should a contractor follow up on a quote?
Set a follow-up date when you send the quote — about a week out is a common interval — and log it so it is a task rather than a memory. Quotes go stale fast: a homeowner who was ready to decide when they called you is collecting other bids by day ten. A single dated follow-up recovers a meaningful share of quotes that would otherwise sit in Pending forever and quietly become losses.