Print on Demand Profit Calculator Spreadsheet: What You Actually Make Per Order
You sell a shirt for $24.99. The base cost is $9.50. So you made $15.49 — and if you sold sixty of them last month, that was a $929 month.
That number is wrong by about 70%, and the gap is where most print-on-demand shops quietly die. Not from a lack of sales. From a lack of subtraction.
Full walkthrough of the template used in this guide.
This guide runs the full stack of costs on one order, then on one month, then shows you how to hold the calculation permanently so it maintains itself as your prices and suppliers change.
Every cost figure below is a labelled assumption, not a quoted rate. Supplier base costs, marketplace fee schedules and shipping charges all move. Substitute your own numbers — the structure is what transfers.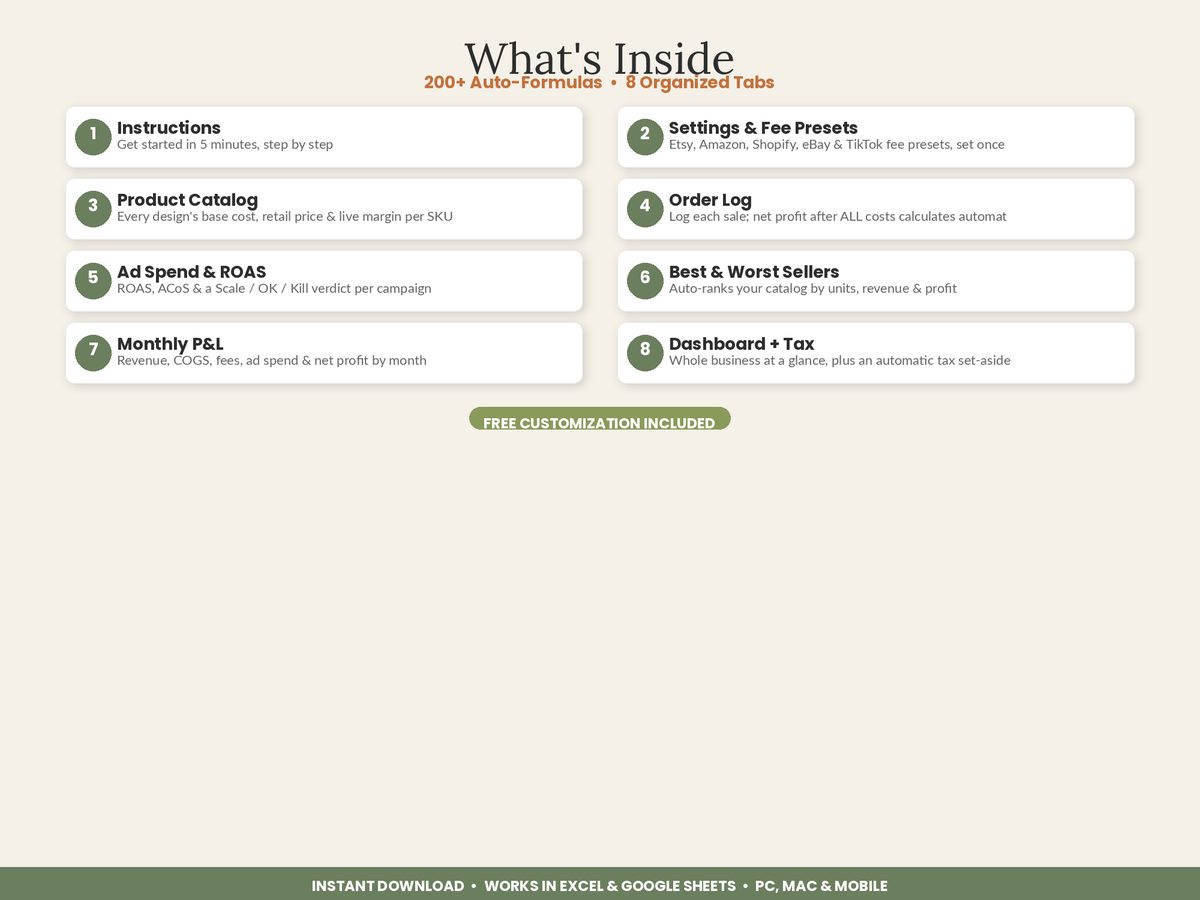
The four layers of cost, in the order they hit you
POD sellers usually count layer one and stop. There are four.
Layer 1 — Product cost. What your print provider charges to make the item.
Layer 2 — Fulfilment cost. What the provider charges to ship it. Separate from the base cost, and yours if the buyer pays nothing for shipping.
Layer 3 — Platform cost. What the marketplace takes: a transaction or referral percentage, a payment-processing percentage plus a flat fee, and often a listing fee. Sometimes an advertising commission on top.
Layer 4 — Acquisition cost. What it cost in ad spend to get that order — or, more honestly, what your total ad spend divided by your total orders comes to.
Then there is the layer that is not a cost at all but behaves like one: tax. Money in the account that was never yours.
The worked example: one $24.99 shirt on Etsy
Assumptions, all mine, all editable:
- Retail price: $24.99, free shipping to the buyer
- Supplier base cost: $9.50
- Supplier shipping: $4.75
- Marketplace fees: 6.5% transaction, 3% + $0.25 payment processing, $0.20 listing fee
- Blended ad cost: $1.20 per order across all orders, paid and organic
- Tax reserve: 25% of net profit
| Line | Amount | Running total |
|---|---|---|
| Sale price | $24.99 | $24.99 |
| Supplier base cost | −$9.50 | $15.49 |
| Supplier shipping | −$4.75 | $10.74 |
| Transaction fee (6.5%) | −$1.62 | $9.12 |
| Payment processing (3% + $0.25) | −$1.00 | $8.12 |
| Listing fee | −$0.20 | $7.92 |
| Blended ad cost | −$1.20 | $6.72 |
| Tax reserve (25% of net) | −$1.68 | $5.04 |
Three numbers matter here, and sellers routinely confuse them.
$15.49 is the number in your head. It is base cost subtracted from retail and it describes nothing real.
$7.92 is your contribution margin — 31.7% — what the order contributes before any marketing. This is the number that decides whether a product deserves to stay in the catalogue.
$6.72 is net profit — 26.9%. This is the business number.
$5.04 is what is actually yours to spend — 20.2% of the sale price.
The shirt did not stop being worth selling. But a seller working from $15.49 will price too low, bid too high on ads, and mistake a break-even month for a good one.
Now the same thing on a month
Sixty orders of that shirt:
| Line | Amount |
|---|---|
| Revenue (60 × $24.99) | $1,499.40 |
| Product cost + shipping (60 × $14.25) | −$855.00 |
| Platform fees (60 × $2.82) | −$169.20 |
| Ad spend (60 × $1.20) | −$72.00 |
| Net profit before overheads | $403.20 |
| Design tools, mockups, subscriptions | −$45.00 |
| Net profit | $358.20 |
| Tax reserve (25%) | −$89.55 |
| Yours | $268.65 |
The naive version of that month was $929.40. The real version is $268.65 — 29% of what the simple sum promised.
Nothing in that table is a disaster. A shop clearing $268 a month on sixty orders is a normal, functioning small POD shop. But the seller who thinks it is a $929 month makes three specific decisions wrong: they run a 20%-off sale that wipes out the entire margin, they accept a $6 cost per acquisition on ads that only clears $7.92 before ads, and they never raise prices because they believe the margin is already generous.
The five columns that make the calculation self-maintaining
Doing this once on a calculator is a useful afternoon. Doing it permanently requires the calculation to live somewhere your orders already are.
The structure that works is five linked pieces:
1. A fee settings table. One row per platform holding its percentage fees and flat fee. Etsy, Amazon Merch, Amazon Seller, Shopify, eBay, TikTok Shop, your own site. Every order row looks its fees up here instead of hard-coding them, so when a marketplace changes a rate you edit one cell and the whole year recalculates. This one design choice is the difference between a spreadsheet that survives a fee change and one that gets abandoned after it.
2. A product catalogue. One row per design: supplier, product type, base cost, shipping cost, retail price — and a calculated profit-per-unit and margin. This is where you find out that three of your designs were priced by feel and are clearing 11%.
3. An order log. Date, product, platform, quantity, sale price. Everything else calculates: gross sale, landed cost pulled from the catalogue, fees pulled from the settings table, ad cost, net profit, margin. Refunded and cancelled orders drop out of the profit total automatically rather than sitting there flattering it.
4. An ad tab. Spend, attributed revenue, orders — returning ROAS, ACoS and cost per order. With a verdict rather than a number, because “ROAS 2.4” means nothing until you know your margin. On a 31.7% contribution margin, a campaign needs roughly 3.2× ROAS to wash its face. Below that it is buying you revenue and selling you profit.
5. A roll-up. Monthly P&L and a dashboard: revenue, COGS, fees, ad spend, net profit, margin, tax to reserve. Plus a best-and-worst-sellers ranking, which is the tab that changes behaviour — because the design you are emotionally attached to is usually not in the top three, and the one that is usually got there without any ad spend at all.
The same design on four platforms is four different products
One thing the calculation exposes immediately: a design’s margin is not a property of the design. It is a property of the design and where you sold it, and the gap between channels is usually larger than the gap between two suppliers.
Three fee structures behave differently enough to change your decisions:
Marketplace fee model — Etsy, eBay, TikTok Shop, Amazon Seller. A percentage of the sale plus, usually, a flat fee. You set the retail price, you carry the base cost, and the marketplace takes its cut on the way out. This is the model every example in this article uses.
Royalty model — Amazon Merch. You do not pay a base cost, do not pay fees, and do not get to keep the difference either. You set a list price and Amazon pays you a royalty: what is left after its production and selling costs. The correct way to enter this in a profit sheet is to record the royalty as the sale price with zero cost and zero fees, because that is exactly what lands in your account. Modelling it like a marketplace sale produces a number that means nothing.
Own-store model — Shopify, WooCommerce, your own site. No referral or listing fee at all, just payment processing — but you are paying a platform subscription and buying every visitor. The per-order margin looks dramatically better and the blended one frequently does not, because the traffic that Etsy or Amazon supplied for a percentage now costs cash up front.
Which is why a seller who moves a $24.99 shirt from a marketplace to their own store and sees margin jump from 31.7% to 38.9% — $7.92 to $9.72 an order, once the only deduction is 2.9% + $0.30 of processing — has not found free money. They have moved a variable cost into a fixed one, and whether that was a good trade depends entirely on volume — exactly the same shape of question as the supplier subscription break-even.
Hold each platform’s fee structure as a row in a settings table and let every order look up its own. Then “which channel is actually working” stops being an argument and becomes a column.
What the calculation tells you to do
Run it across a catalogue and the same four decisions surface almost every time.
Kill the sub-15% products. Not because low margin is immoral, but because low-margin products cannot absorb a refund, a reprint or a single unprofitable ad test. A 12%-margin shirt needs eight clean sales to survive one lost package.
Reprice rather than re-advertise. Moving a shirt from $24.99 to $27.99 adds roughly $2.72 of net profit per order after the extra percentage fees — a 40% increase in net on that product for zero extra spend. Almost no ad optimisation available to a small shop delivers 40%.
Treat supplier shipping as a product decision. Two designs on the same garment from different providers can differ by $3 a unit once shipping is counted. On sixty orders that is $180 a month, which is likely more than the difference between your best and worst ad month.
Reserve tax weekly, not annually. POD income arrives in small amounts that feel spendable. A percentage moved out on the same day as your weekly reconciliation is the only version of this that works.
Where each of these goes deeper
Four questions come up so often that each has its own walkthrough:
- Comparing suppliers on true landed cost, including the subscription break-even: Printify vs Printful profit per shirt
- The full fee-by-fee breakdown on one marketplace: how much it costs to sell a print on demand t-shirt on Etsy
- Working backwards from a target margin to a price: how to price a print on demand t-shirt for a 30% margin
- The costs that quietly eat the difference: why your print on demand shop isn’t profitable
If you also sell handmade rather than printed items, the fee mechanics differ enough to be worth reading separately — see how much Etsy takes from a $20 sale — and if you are weighing paid traffic on a thin margin, the break-even ROAS calculation is the one to run first.
The honest summary
Print on demand has no inventory risk, which is its great advantage, and thin per-unit margins, which is its great constraint. The two are the same fact viewed from different ends: you did not pay for the shirt up front, so you do not get the volume discount.
That constraint is completely survivable — but only if you are working from the real number. A shop with a 27% net margin and a seller who knows it is a business. A shop with a 27% net margin and a seller who thinks it is 62% is a countdown.
Featured on ReadySheetGo
The Print on Demand Profit & Order Tracker is the five-piece structure above, already built. 8 tabs: a Settings & Fee Presets tab with editable presets for Etsy, Amazon Merch, Amazon Seller, Shopify, eBay, TikTok Shop and your own site; a Product Catalog with live profit and margin per design; a 300-row Order Log where net profit after base cost, shipping, platform fees and ad spend calculates itself on every row, with refunds excluded automatically; an Ad Spend & ROAS tab returning ROAS, ACoS, cost per order and a Scale / OK / Kill verdict; a Best & Worst Sellers ranking; a Monthly P&L; a Dashboard with revenue, net profit, average margin, units, fees and tax to set aside; and a Tax & Deductions log. Sample data pre-filled across six designs. Excel + Google Sheets, no macros. Instant digital download — $14.99.
Frequently Asked Questions
What is a realistic profit margin for print on demand?
Most POD sellers land somewhere between 15% and 35% net margin on a garment once base cost, supplier shipping, platform fees and blended ad spend are all subtracted — not the 50–60% the base-cost-versus-retail sum suggests. In the worked example in this article a $24.99 shirt with a $9.50 base cost looks like a $15.49 win and settles at $6.72 after every real cost, or 26.9%. Anything above 30% net on a garment usually means either a premium price point, no paid traffic, or a cost you have not counted yet.
Should ad spend be counted per order or across the whole month?
Both, and they answer different questions. Attributed ad cost on the specific order tells you whether that campaign is working. Blended ad cost — total monthly ad spend divided by total monthly orders, including organic ones — tells you whether the business is working. Sellers who only look at attributed cost routinely believe every campaign is profitable while the bank balance falls, because organic orders are absorbing spend that never got attributed. Track the per-order figure on each row and the blended figure on the dashboard.
Does the supplier's shipping charge come out of my profit?
Yes, on almost every POD platform. The supplier charges you a base cost plus a shipping charge per order, and if you advertise free shipping to the buyer — which most marketplaces effectively require — that shipping charge is yours. It is the single most commonly forgotten line in POD maths and on a t-shirt it is often 20–35% of the base cost. Enter it as its own column so you can see what it is costing you rather than burying it in a blended figure.
How much should I set aside for tax on print on demand income?
The tracker defaults to reserving 25% of net profit, which is a common starting point for a US self-employed seller covering self-employment tax plus federal income tax at a modest bracket — but the right number depends on your total household income, your state and your filing status, so treat it as a placeholder and adjust it. The important habit is reserving from net profit as it is earned rather than from revenue, and moving the money to a separate account the same day you reconcile the month.