How to Price a Print on Demand T-Shirt for a 30% Profit Margin
Most POD pricing advice is a multiplier: take your base cost, multiply by two or three, done.
It does not work, and the reason is structural rather than a matter of degree. Multiplying handles the costs that are fixed per unit — the garment, the printing — and completely ignores the ones that are a percentage of the price you just set. Raise the price and the fees rise with it. So a 3× markup gives you a different margin on every product, and you have no way of knowing which ones are the bad ones.
Full walkthrough of the template used in this guide.
The fix is to stop calculating forwards from cost and start solving backwards from the margin you want.
All figures below are labelled assumptions. Substitute your own supplier costs and your platform’s current fee schedule.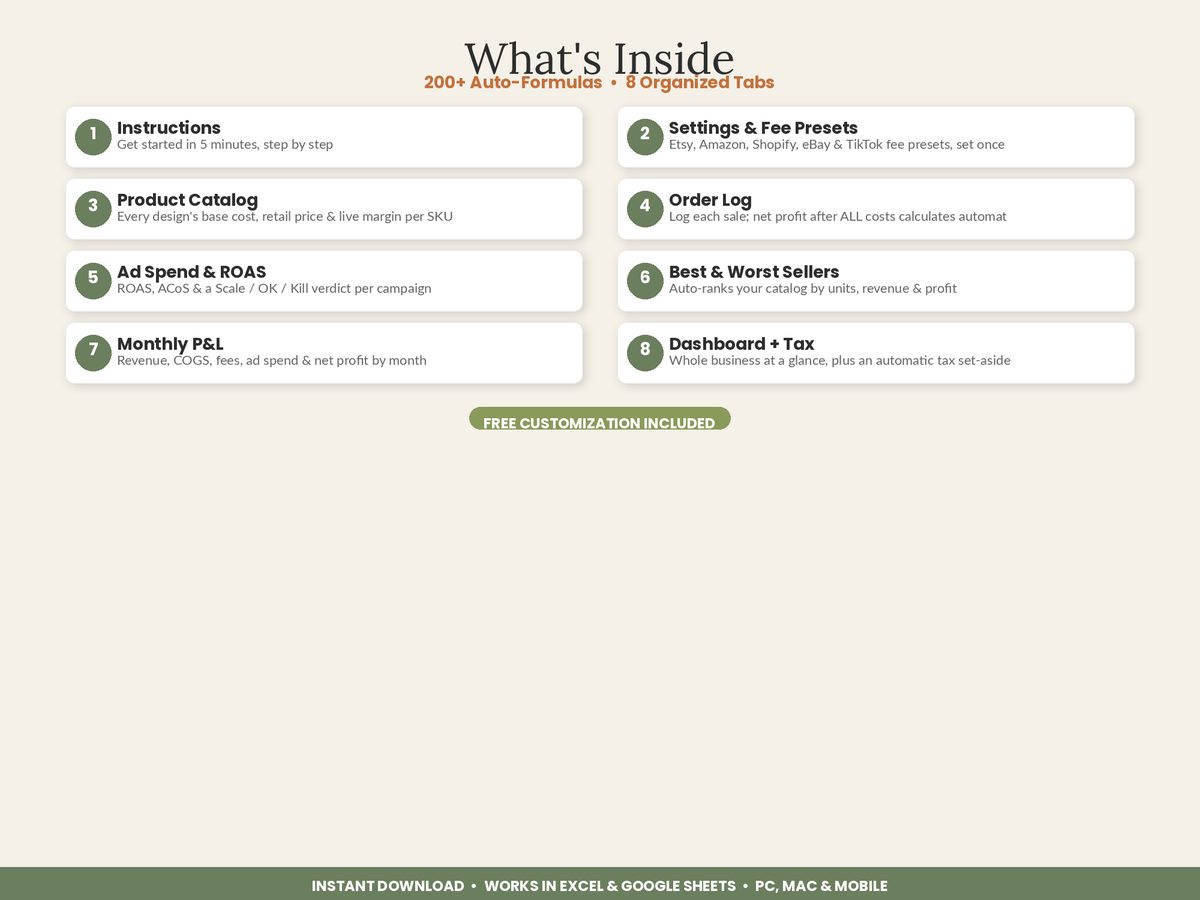
Sort your costs into two buckets first
This is the whole trick. Two kinds of cost behave differently when the price changes:
Fixed per unit — unchanged by price:
- Supplier base cost: $9.50
- Supplier shipping: $4.75
- Listing fee: $0.20
- Payment processing flat fee: $0.25
- Total fixed: $14.70
Percentage of price — rises with price:
- Transaction fee: 6.5%
- Payment processing: 3%
- Total percentage: 9.5%
Multiplier pricing pretends the second bucket does not exist. That is the error.
The formula
Price = Fixed costs per unit ÷ (1 − Target margin − Percentage fees)
For a 30% net margin:
Price = $14.70 ÷ (1 − 0.30 − 0.095) = $14.70 ÷ 0.605 = $24.30
Round to a real price point — $24.99 — and check it:
| Line | Amount |
|---|---|
| Sale price | $24.99 |
| Base cost + supplier shipping | −$14.25 |
| Percentage fees (9.5% of $24.99) | −$2.37 |
| Flat fees ($0.25 + $0.20) | −$0.45 |
| Profit | $7.92 |
| Margin | 31.7% |
Target hit, with a little room. And notice what the multiplier method would have told you: 3 × $9.50 = $28.50, or 2 × $9.50 = $19.00 — one $4 too high for the target, the other producing a margin of about 13%. Neither is 30%, and neither method would have told you so.
Now do it again with ad spend in it
The calculation above is your contribution margin — the product before marketing. If you run paid traffic, that is not the number you take home.
Add advertising as a percentage of revenue. Say ad spend runs 8% of revenue across the shop:
Price = $14.70 ÷ (1 − 0.30 − 0.095 − 0.08) = $14.70 ÷ 0.525 = $28.00
| Line | Amount |
|---|---|
| Sale price | $28.00 |
| Base cost + supplier shipping | −$14.25 |
| Percentage fees (9.5%) | −$2.66 |
| Flat fees | −$0.45 |
| Ad spend (8% of revenue) | −$2.24 |
| Net profit | $8.40 |
| Net margin | 30.0% |
$24.99 without ads. $28.00 with them. Same shirt, same supplier, same target — a $3 difference that comes entirely from a decision about traffic. This is the single most useful thing the formula does: it prices advertising in before you commit to it, instead of discovering afterwards that the campaign was funded out of your margin.
The reverse question: what margin is my current price giving me?
Every existing product deserves this run on it once:
Margin = (Price − Fixed costs − (Price × Percentage fees)) ÷ Price
Run it across a catalogue and the result is almost always the same shape: a couple of products comfortably above target, most within a few points of it, and one or two — usually the cheapest items, where the $0.45 of flat fees is a much bigger share of the price — sitting near or below 10%.
Those are not products with a marketing problem. They are products with a pricing problem, and no amount of traffic fixes a design that loses money faster the more of it you sell.
Three things that break the formula
Sales and coupons come off the top. A 20% discount on the $24.99 shirt does not cost you 20% of your margin — it takes the price to $19.99 and the profit from $7.92 to $3.39 — a 57% cut in what you keep. On a thin-margin model, a routine discount is closer to a giveaway than a promotion. If you intend to run sales regularly, price for them: build the discount into the percentage bucket and let the formula return the everyday price that can carry it.
Free shipping to the buyer is not free. It is already inside the $14.25 in these examples because the supplier charges it to you. If you charge shipping instead, add it to the price and remember that most marketplaces charge their transaction percentage on shipping too.
Refunds are not modelled here at all. A refunded POD order costs you the landed cost, because the item was already made. At a 2% refund rate on this shirt that is roughly $0.29 an order — small, but it is the difference between a 31.7% margin and a 30.6% one, and it is worth knowing which side of your target you are really on.
For the complete cost stack this formula sits inside, see the print on demand profit calculator guide. For the exact fee figures on one marketplace, see what it costs to sell a POD t-shirt on Etsy. And if the price the formula returns is higher than your market will bear, the answer is probably on the cost side — see the supplier comparison.
Featured on ReadySheetGo
The Print on Demand Profit & Order Tracker runs this in reverse for you: enter a design’s base cost, shipping cost and retail price in the Product Catalog and it returns profit per unit and live margin percentage, so you can nudge the price until the margin column says what you want. Percentage fees come from an editable Settings tab with presets for Etsy, Amazon Merch, Amazon Seller, Shopify, eBay and TikTok Shop, so the same design priced for two platforms shows two honest margins. 8 tabs including a 300-row Order Log, an Ad Spend & ROAS tab with a Scale / OK / Kill verdict, a Best & Worst Sellers ranking, a Monthly P&L, a Dashboard and a Tax & Deductions log. Sample data pre-filled. Excel + Google Sheets, no macros. Instant digital download — $14.99.
Frequently Asked Questions
Why can't I just multiply my base cost by three?
Because the multiplier method ignores everything that scales with the sale price rather than the cost. Percentage fees rise as you raise the price, so a 3× markup does not produce a consistent margin — it produces a different margin at every price point, and a worse one the more of your costs are percentage-based. On the example in this article, 3× the $9.50 base cost gives $28.50 and looks generous until supplier shipping and the 9.5% in percentage fees are subtracted. Solve for the price instead; the multiplier that results will be different for every product.
Is 30% a realistic net margin for print on demand?
It is achievable on garments at mid-range price points without paid traffic, and it gets hard once meaningful ad spend is in the mix — which is why the second calculation in this article, the one that reserves 8% of revenue for advertising, lands at a noticeably higher price. If your market will not support the price that a 30% margin requires, the honest options are a cheaper landed cost, a higher-perceived-value product, or accepting a lower target. Repricing to a number the market rejects is not a margin strategy.
Should the target margin be calculated before or after ad spend?
Decide which one you mean and be consistent, because the two differ by several dollars of price. Margin before advertising is your contribution margin and it tells you whether the product itself is sound. Margin after advertising is net margin and it tells you whether the business is sound. If you run any paid traffic at all, price against net margin — otherwise you will build a catalogue of products that each look healthy and a shop that does not make money.
What price should I use for a product I sell on several platforms?
Run the formula once per platform, because the fee percentages differ enough to move the answer by a dollar or more, then decide deliberately. Most sellers set one price at the level the highest-fee platform requires and accept the extra margin everywhere else, which is simpler and avoids buyers finding two prices. The alternative — a different price per channel — is defensible but only if you are prepared to maintain it as fees change.