How to Split Kids’ Expenses by Income Instead of 50/50 (With the Ratio Table)
Fifty-fifty feels like the fair default, and for two parents earning roughly the same it is. The trouble starts when they are not.
An even split of a $620 childcare bill is $310 each. Against a $42,000 income that is a materially bigger bite than the same $310 against $58,000 — same dollars, different weight. Which is why a lot of agreements pro-rate at least some categories to income, and why the question what percentage, exactly turns up so often.
Full walkthrough of the template used in this guide.
The arithmetic takes one line. Everything hard about this is the two decisions either side of it.
The Calculation
Each parent’s share is their income divided by the two incomes combined.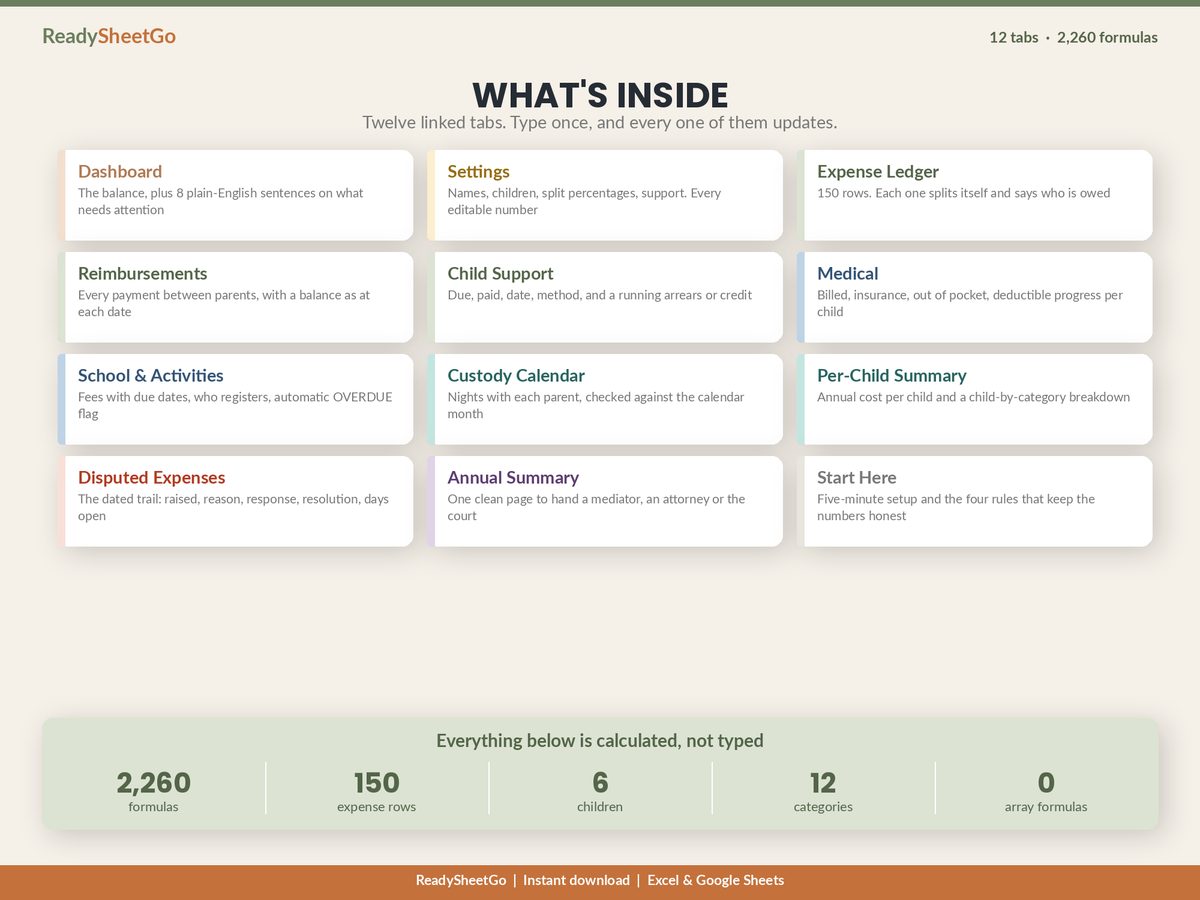
Parent A's share = A's income ÷ (A's income + B's income)
Parent B's share = 100% − Parent A's share
That second line matters more than it looks. Derive the second percentage rather than typing it, and the pair can never drift apart, never total 97%, and never need checking.
The Ratio Table
Common income pairs, rounded to the nearest whole percent:
| Parent A | Parent B | Combined | A’s share | B’s share |
|---|---|---|---|---|
| $40,000 | $40,000 | $80,000 | 50% | 50% |
| $48,000 | $42,000 | $90,000 | 53% | 47% |
| $58,000 | $42,000 | $100,000 | 58% | 42% |
| $62,000 | $38,000 | $100,000 | 62% | 38% |
| $75,000 | $45,000 | $120,000 | 63% | 37% |
| $80,000 | $40,000 | $120,000 | 67% | 33% |
| $90,000 | $30,000 | $120,000 | 75% | 25% |
| $110,000 | $55,000 | $165,000 | 67% | 33% |
| $125,000 | $45,000 | $170,000 | 74% | 26% |
Two things fall out of the table. The ratio depends only on the proportion, not the amounts — $80,000 and $40,000 gives the same 67/33 as $110,000 and $55,000. And the ratio moves fast at the wide end: a parent earning three times the other carries three times the cost, which is exactly the point of the method and also the reason it needs to be agreed rather than imposed.
What It’s Worth, On One Bill
Take after-school care at $620 a month.
| Split | Parent A pays | Parent B pays | B’s annual difference vs 50/50 |
|---|---|---|---|
| 50 / 50 | $310.00 | $310.00 | — |
| 53 / 47 | $328.60 | $291.40 | −$223.20 |
| 58 / 42 | $359.60 | $260.40 | −$595.20 |
| 63 / 37 | $390.60 | $229.40 | −$967.20 |
| 67 / 33 | $415.40 | $204.60 | −$1,264.80 |
| 75 / 25 | $465.00 | $155.00 | −$1,860.00 |
One recurring bill, one ratio decision, and the gap between the ends of that table is over $1,800 a year. Multiply across childcare, medical and activities and the choice of method is one of the larger financial decisions in the whole arrangement — which is why it deserves a written line rather than an assumption.
Which Income Figure?
This is where the method actually stalls, so decide it explicitly and write it into the same place the percentages live.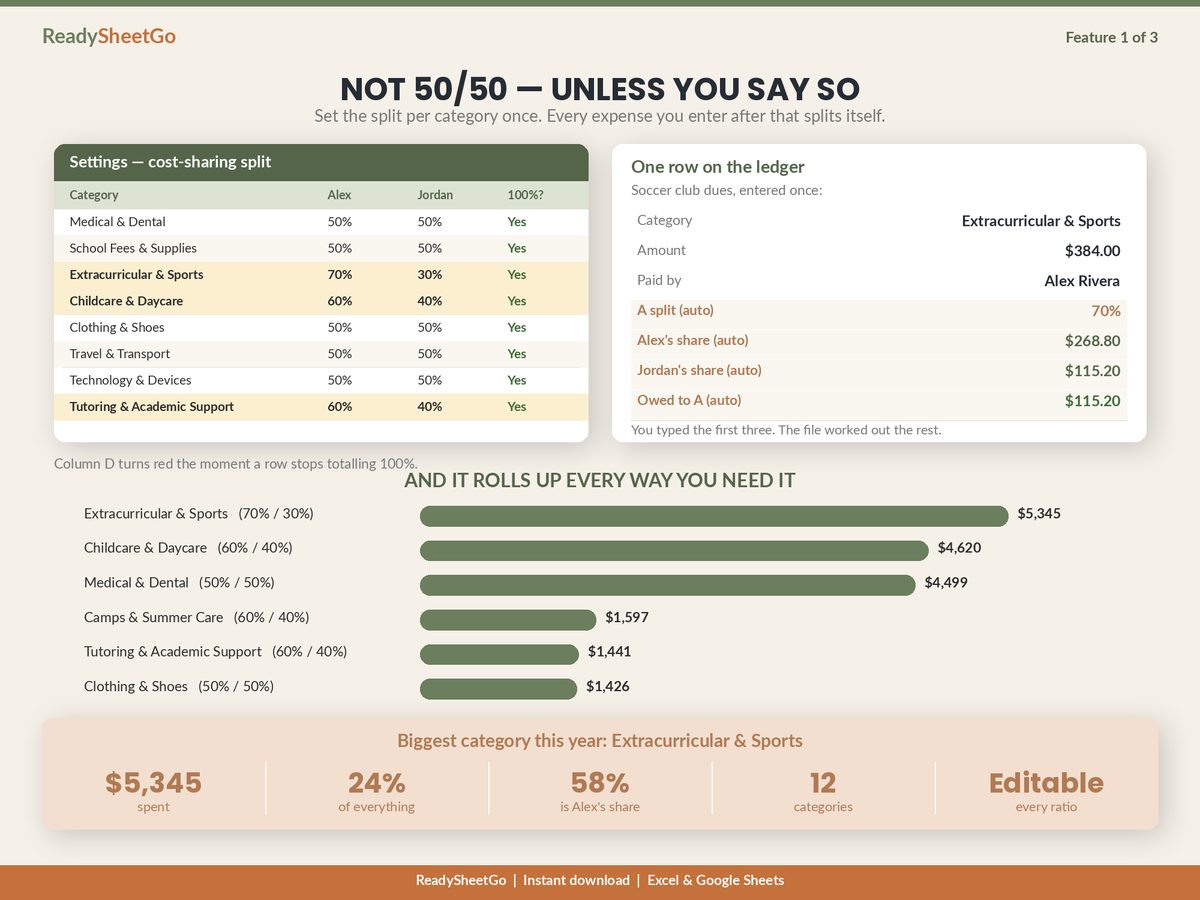
Gross income is the simpler choice. It is evidenced from a pay stub or a tax return, it is hard to dispute, and it needs no further definition. Its weakness is that two people with identical gross incomes can have quite different take-home pay.
Net income is closer to what each household can actually spend, but it requires you to define net. Does it mean gross less tax only? Less health premiums? Less retirement contributions — and if so, is there a cap, given that a voluntary contribution is a choice that shifts the ratio? Most people who go this route end up specifying it narrowly, as gross less tax and mandatory deductions, precisely to shut that discussion down.
Variable income — self-employment, commission, seasonal work — needs a stated averaging window. A twelve-month trailing average is the usual answer, refreshed on the same schedule as everything else.
Whichever you pick, record three things next to the percentages: the figure used, the source it came from, and the date it was set. A ratio with no provenance is a ratio you will re-argue.
Not Everything Has to Be Pro-Rated
Applying a 63/37 ratio to a $22 field trip is technically consistent and practically pointless. The $8 difference does not repay the friction of computing it, and small items are where record-keeping quietly dies.
A common structure, and a sensible default: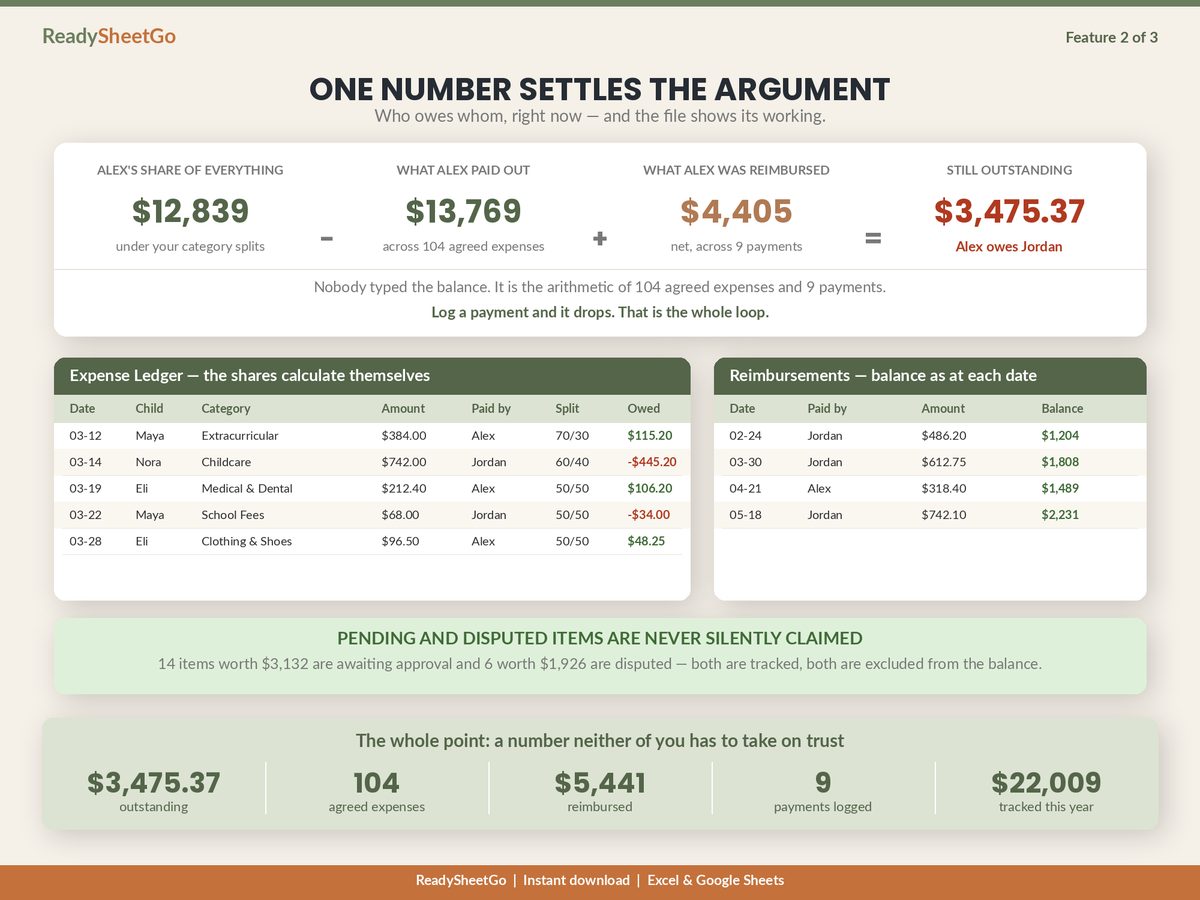
| Category | Method | Reasoning |
|---|---|---|
| Childcare | Pro-rated | Large, recurring, unavoidable |
| Medical & dental | Pro-rated or 50/50 | Often set by the agreement itself |
| Tuition & school fees | Pro-rated | Large and predictable |
| Extracurriculars | Negotiated per activity | One parent often wants it more |
| Clothing & small items | 50/50 | Not worth the arithmetic |
The practical requirement this creates is that your tracker has to hold a ratio per category, not one global number. A file with a single split percentage at the top forces you to choose between fairness on the big costs and sanity on the small ones. A file with a ratio per row of a settings table lets you have both, and lets you change childcare next year without touching anything else.
What It Did to a Real Balance
The worked six-month example in the main guide runs $8,692.00 of agreed expenses across two children, with childcare at 60/40, extracurriculars at 70/30, and medical, school and clothing at 50/50.
Under those agreed ratios, the closing balance is $656.30.
Run the identical ledger — same expenses, same payer on every line, same $2,600.00 of reimbursements — at a flat 50/50 on everything, and the closing balance is $83.00.
A $573.30 difference in six months, out of a decision that nobody experienced as a financial one at the time they made it. Neither number is wrong; they answer different agreements. But only one of them matches what these two parents actually wrote down, and a file that assumes the other will quietly produce a figure the other parent does not recognise.
The Thing Worth Remembering
Divide one income by the two combined, derive the second percentage rather than typing it, and store the result per category rather than globally. Then write down which income figure you used, where it came from, and when you will look at it again.
The arithmetic is one line. The agreement around it is the part that has to survive the year.
This is one layer of the full build: the complete co-parenting expense tracker, with the status column, the payment log and the balance that writes itself, is here.
Featured on ReadySheetGo
Co-Parenting & Blended Family Shared Expense Tracker — $14.99
Twelve linked tabs and 2,260 working formulas, with a full fictional sample year loaded so you can see the ratio arithmetic running before you type anything.
The Settings tab holds the split percentage for every one of twelve expense categories — medical evenly, childcare pro-rated, extracurriculars at whatever you negotiated — so you are never forced to choose one global number. Type one parent’s percentage and the other works itself out, with a check that turns red the moment a category stops totalling 100%. Change the childcare ratio and every childcare row in the ledger re-splits itself at once.
The Expense Ledger gives you 150 rows, each splitting by its own category’s ratio, with a status on every row so only Agreed items reach the balance. Reimbursements logs every payment between parents with the running balance as it stood on that date. Per-Child Summary returns the annual cost per child — the number most agreements get reviewed against, and the one you will want when the ratio comes up for renewal. Annual Summary prints the whole position onto one page with signature lines.
No macros, no add-ons, no array formulas — it calculates identically in Excel and Google Sheets. It organises your own records; it is not legal advice and does not interpret your custody order.
Get the Co-Parenting & Blended Family Shared Expense Tracker →
Frequently Asked Questions
How do you calculate an income-based split of children's expenses?
Divide each parent's income by the two incomes combined. On $58,000 and $42,000 the combined figure is $100,000, so the shares are 58% and 42%. That is the whole calculation — the difficulty is never the arithmetic, it is agreeing which income figure goes into it and how often it gets refreshed. Write both of those down at the same time you write the percentages, because a ratio with no stated source and no review date is the thing that gets re-argued a year later.
Should we use gross or net income for the split?
Either works provided you both use the same one and write down which. Gross is simpler, easier to evidence from a pay stub or tax return, and harder to argue about. Net is arguably fairer because it reflects what each household actually has to spend, but it opens a second negotiation over which deductions count — retirement contributions, health premiums, a new partner's income — and those negotiations are where the method usually stalls. Most people who choose net end up specifying it narrowly, as gross less tax and mandatory deductions only.
Does an income split apply to every category?
It does not have to, and in practice it often should not. Many agreements pro-rate the large recurring costs — childcare, medical, tuition — while splitting small or discretionary items evenly, because the administrative friction of applying a 63/37 ratio to a $22 field trip is not worth the fairness it buys. Setting the ratio per category rather than globally lets you do both in one file, and it means changing one category later does not disturb the others.
What happens to the split when someone's income changes?
Nothing, until you both agree to change it — which is why a review interval belongs in the agreement rather than in someone's inbox. A common approach is to fix the percentages for a set period, often annually, and recalculate on a stated date with stated evidence. Recalculating continuously means the ratio is never settled and every month becomes a small negotiation. Recalculating never means a ratio built on a job somebody left three years ago is still running the arithmetic.