Employee PTO Tracker Spreadsheet: Accruals, Requests and Balances for a Small Team
Most small-business leave tracking falls over in the same place. It is not the vacation itself — it is the question three months later: how much does she actually have left? Somebody opens a spreadsheet, finds a column labelled “days remaining” that was last typed by hand in January, and nobody can reconstruct how the number got there.
The fix is not a better-looking grid. It is deciding that no balance in the file is ever typed — every one of them is derived from three logs: who works here, what they worked, and what they took. Once that is true, the balance is correct on a random Tuesday in October without anyone maintaining it.
Full walkthrough of the template used in this guide.
Here is how to build that, worked end to end on an eight-person team, including the part most templates skip entirely: attendance points that expire on their own.
The Worked Example
Everything below runs on the same invented business — Northgate Supply Co., eight people, a mix of full- and part-time. The wages, dates and policy numbers are made up; the arithmetic is the arithmetic. The as-of date is 31 March 2026, one quarter into the year.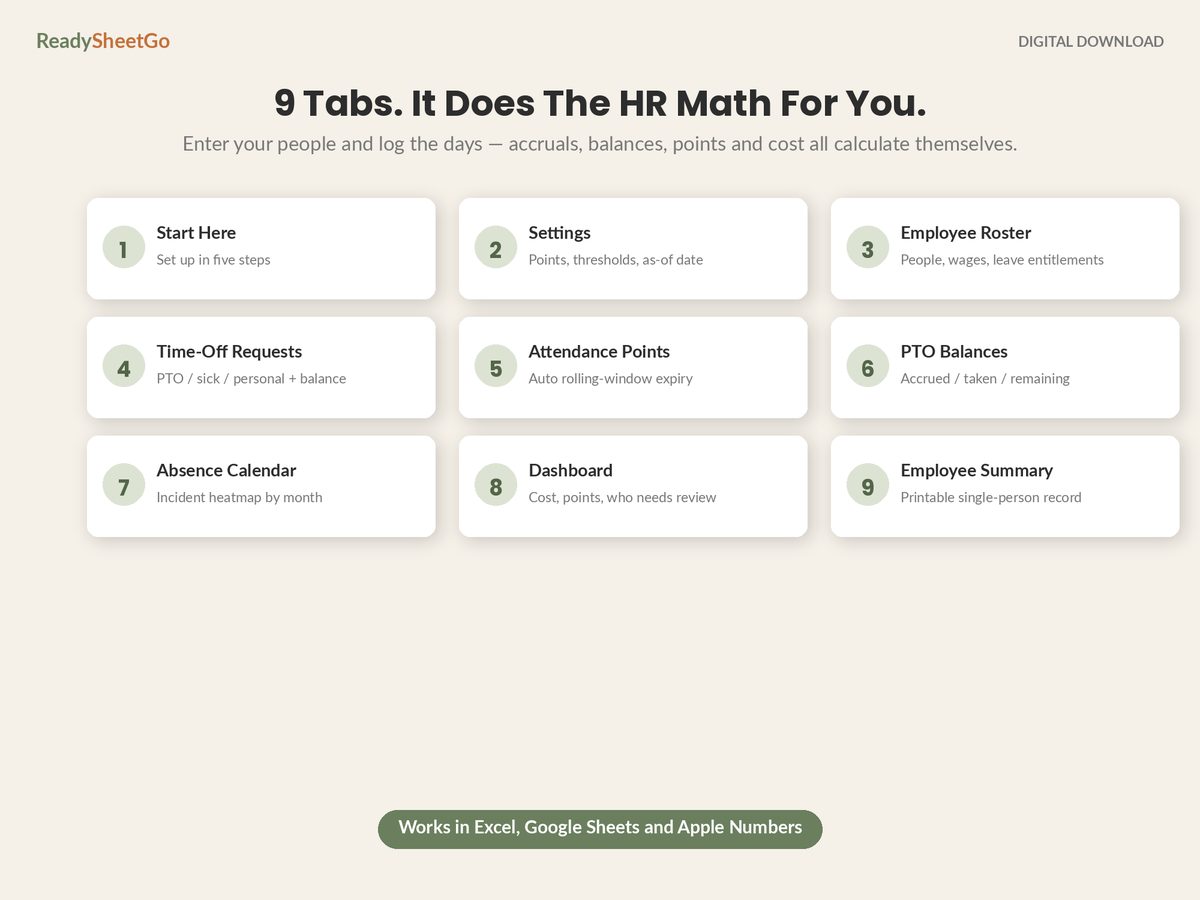
The policy, set once and never re-typed:
| Setting | Value |
|---|---|
| PTO entitlement (full-time) | 80 hours/year |
| Accrual method | Per hour worked |
| Accrual rate | 0.0385 hours of PTO per hour worked |
| Sick leave | 40 hours, front-loaded 1 Jan |
| Personal leave | 16 hours, front-loaded 1 Jan |
| Attendance point window | Rolling 12 months |
| Warning thresholds | 4 verbal · 6 written · 8 final · 10 termination review |
The accrual rate is not a guess. It is 80 ÷ 2,080 — the annual entitlement divided by the hours in a standard full-time year. Set it that way and part-time staff prorate themselves with no second policy and no second formula, which you will see two tables down.
Layer One: Accrued, Taken, Remaining
One row per person. Hours worked comes from payroll, hours taken comes from the approved-request log, and both of the last two columns are formulas.
| Employee | Role | Wage | Hire date | Hours worked YTD | PTO accrued | PTO taken | Balance |
|---|---|---|---|---|---|---|---|
| Dana Whitfield | Warehouse Lead | $26.00 | 08 Apr 2019 | 520 | 20.0 | 8.0 | 12.0 |
| Marcus Ellery | Driver | $23.50 | 13 Sep 2021 | 512 | 19.7 | 16.0 | 3.7 |
| Nadia Osei | CSR | $19.75 | 06 Feb 2023 | 500 | 19.3 | 0.0 | 19.3 |
| Tom Brennan | Warehouse | $19.00 | 04 Nov 2024 | 520 | 20.0 | 24.0 | −4.0 |
| Lena Kowalczyk | Picker (24 hrs/wk) | $18.25 | 16 Jun 2025 | 312 | 12.0 | 0.0 | 12.0 |
| Ruben Diaz | Driver | $23.50 | 02 Feb 2026 | 336 | 12.9 | 0.0 | 12.9 |
| Amara Boateng | Office Admin | $21.00 | 19 Mar 2018 | 496 | 19.1 | 12.0 | 7.1 |
| Grant Sheppard | Warehouse | $19.00 | 25 Jul 2022 | 464 | 17.9 | 0.0 | 17.9 |
Three things in that table are doing real work.
Lena prorated herself. She works 24 hours a week, nobody wrote a part-time policy, and she has accrued 12.0 hours against a full-timer’s 20.0 — exactly 60%, exactly her share of a full-time week. That falls out of accruing per hour worked instead of per calendar month. The full accrual-rate arithmetic, including the per-pay-period and front-loaded alternatives, is here.
Ruben needed no proration either. He started 2 February. Under a front-loaded policy somebody would now be calculating eleven-twelfths of 80 hours and writing 73.3 into a cell. Under per-hour accrual he has simply worked fewer hours, so he has simply accrued less. There is no mid-year-hire formula because there is no mid-year-hire problem.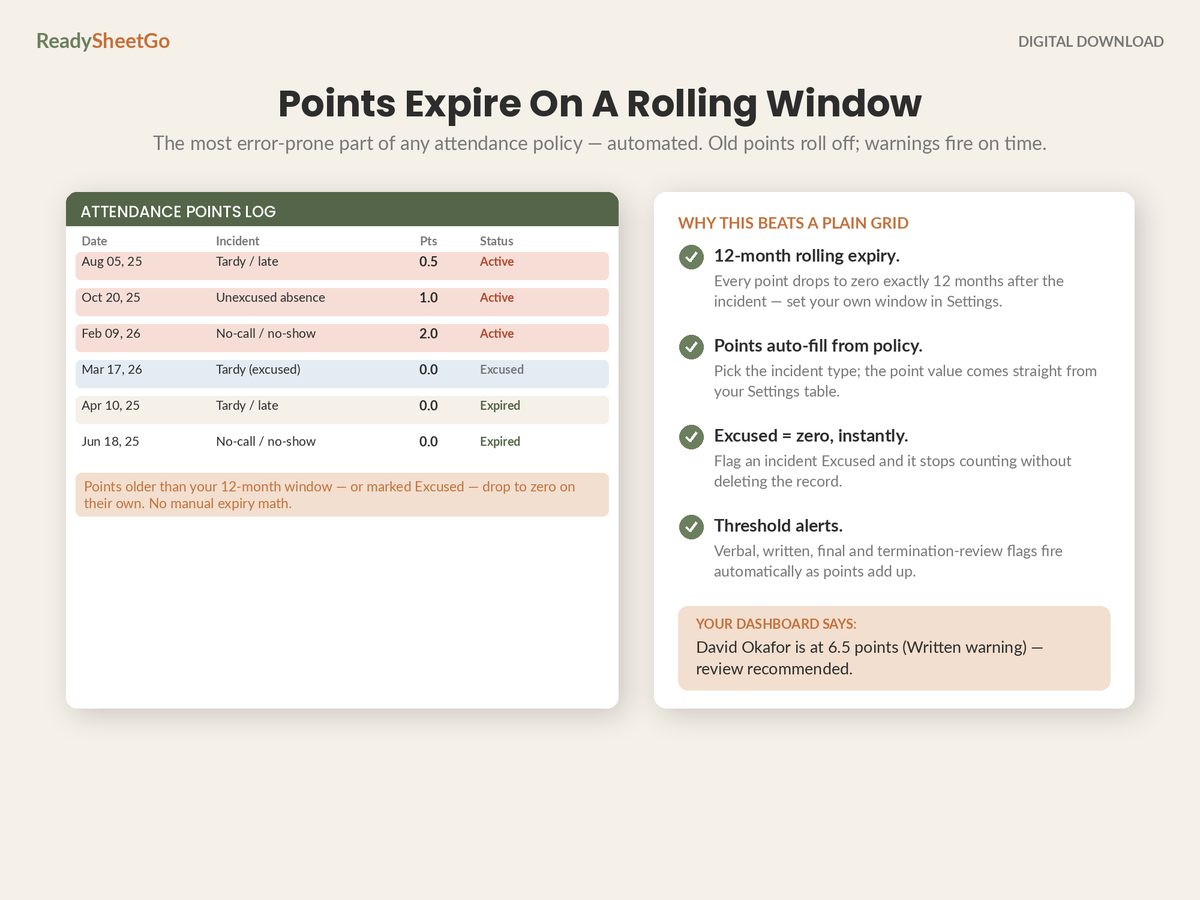
Tom is at minus four. He took 24 hours having accrued 20. That is not a bug to be clamped away with MAX(0, ...) — it is a genuine liability sitting on your payroll, and the only version of the sheet worth having is the one that shows it.
The formula behind the accrued column, in Excel or Google Sheets:
=MIN( Settings!$B$3, SUMIFS(Payroll!$C:$C, Payroll!$A:$A, $A2) * Settings!$B$5 )
Settings!B3 is the annual cap, B5 is the 0.0385 rate. The MIN is the accrual cap: without it, somebody working heavy overtime quietly accrues more than a year’s entitlement.
And the balance, which is the whole point of the file:
=C2 - SUMIFS(Requests!$E:$E, Requests!$A:$A, $A2, Requests!$D:$D, "Approved")
Note "Approved". Pending requests must not reduce the balance, or a request that gets denied permanently eats four hours of somebody’s leave. But pending hours should be visible somewhere, because a manager approving Friday needs to know two other people already have Friday pending.
Layer Two: The Request Log
One row per request, and it is the only place leave is ever recorded.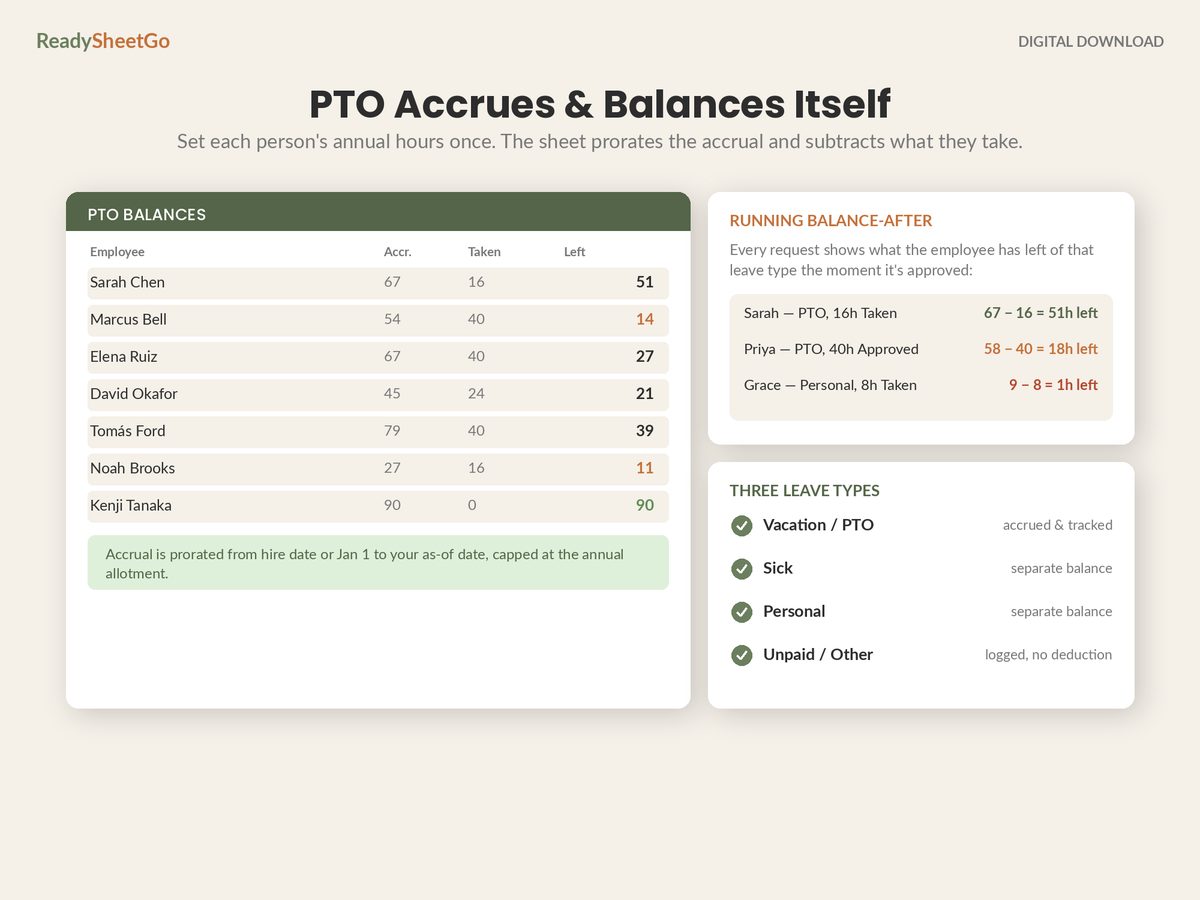
| Date submitted | Employee | Type | Dates off | Hours | Status |
|---|---|---|---|---|---|
| 04 Jan 2026 | Marcus Ellery | PTO | 12–13 Feb | 16.0 | Approved |
| 22 Jan 2026 | Amara Boateng | PTO | 09–10 Mar | 12.0 | Approved |
| 02 Feb 2026 | Tom Brennan | PTO | 23–25 Feb | 24.0 | Approved |
| 18 Feb 2026 | Dana Whitfield | PTO | 27 Mar | 8.0 | Approved |
| 03 Mar 2026 | Nadia Osei | Sick | 05 Mar | 8.0 | Approved |
| 19 Mar 2026 | Grant Sheppard | PTO | 06–08 Apr | 24.0 | Pending |
| 20 Mar 2026 | Lena Kowalczyk | PTO | 07 Apr | 8.0 | Pending |
Grant’s pending request is the useful case. He has 17.9 hours accrued and has asked for 24. Approve it and he goes to minus 6.1. A sheet that shows the balance after a pending request — before anyone clicks approve — turns that from an awkward conversation in April into a two-second decision in March.
Two pending requests also land on the same week in April. That is a coverage problem, not a balance problem, and it is the seam where leave tracking meets rostering: the hours are available, the people are not.
Layer Three: Attendance Points That Expire Themselves
This is the part homemade trackers almost never get right, and it is the part that carries the most risk.
Most no-fault attendance policies assign points to incidents and expire each point a fixed period after the incident — usually twelve months. Adding points up is trivial. Rolling them off is where the errors live, because every single point has its own expiry date, and the total changes on days when nothing at all happened.
Northgate’s point values, set once on the Settings tab:
| Incident | Points |
|---|---|
| Late, under 15 minutes | 0.5 |
| Late, over 15 minutes | 1.0 |
| Left early without approval | 1.0 |
| Absent, called in | 1.0 |
| Absent, no notice | 2.0 |
| No call, no show | 3.0 |
| Approved leave / protected leave | 0.0 |
Marcus Ellery’s incident log, scored as of 31 March 2026:
| Incident date | Incident | Points | Expires | Active on 31 Mar 2026? |
|---|---|---|---|---|
| 14 Feb 2025 | Late, over 15 min | 1.0 | 14 Feb 2026 | No — expired |
| 02 May 2025 | No call, no show | 3.0 | 02 May 2026 | Yes |
| 20 Nov 2025 | Absent, no notice | 2.0 | 20 Nov 2026 | Yes |
| 09 Jan 2026 | Late, under 15 min | 0.5 | 09 Jan 2027 | Yes |
| 06 Mar 2026 | Left early | 1.0 | 06 Mar 2027 | Yes |
| Lifetime total | 7.5 | |||
| Active total | 6.5 |
Lifetime 7.5, active 6.5, and only the second number means anything. At 6.5 Marcus has crossed the written-warning threshold and sits 1.5 points below a final written warning.
Now watch what happens with nobody doing anything. On 3 May 2026 the no-call-no-show ages out. Marcus drops from 6.5 to 3.5 — below the written threshold, below the verbal threshold — on a morning when he did nothing but turn up on time. If your tracker is a typed running total, it will still say 6.5 on that day, and a disciplinary conversation held on that number is one you should not be having.
The single formula that does the whole job:
=SUMIFS(Points!$D:$D, Points!$B:$B, $A2,
        Points!$A:$A, ">="&EDATE(Settings!$B$2, -12),
        Points!$A:$A, "<="&Settings!$B$2)
Settings!B2 is your as-of date. EDATE(as_of, -12) is exactly twelve months back. Change the as-of date to any day you like and every point total in the file re-scores itself for that day — which is how you answer “what did this look like when we issued the warning” six months later.
Whether that window should roll at all, or reset every January, changes the answer dramatically: scored on a calendar year instead, Marcus has 1.5 points and no warning — same person, same five incidents, five points apart.
One carve-out you cannot skip. Legally protected absence — leave covered by the FMLA, an ADA accommodation, state paid-sick-leave law, jury duty, military leave and similar — should not earn attendance points under a no-fault policy. That is the single most common way these systems create liability. Build a “protected / excused” flag into the incident log that forces the points to zero, so the exclusion is a checkbox rather than something someone remembers. This is a record-keeping article, not legal advice; run your written policy past an employment lawyer in your state before you enforce a ladder against anyone.
Layer Four: What the Absence Actually Cost
The last column most trackers are missing is money. Unscheduled absence has a cash cost, and it is not the same as the absent person’s wage.
Northgate lost 96 unscheduled hours in Q1. The quarter’s cash cost came to $3,354 — about $34.94 for every absent hour, on an average wage of $21.50. The full three-part calculation, including why the cover costs more than the absence, is worked out here.
Putting that number on the dashboard changes what the tracker is for. A points column is a discipline tool and people treat it like paperwork. A dollar figure next to it is a business number, and business numbers get attention.
The Thresholds Ladder
Four thresholds, and the file should surface them automatically rather than waiting for someone to scan a column:
| Active points | Action |
|---|---|
| 4.0 | Verbal warning, documented |
| 6.0 | Written warning |
| 8.0 | Final written warning |
| 10.0 | Termination review |
The specific numbers matter far less than their relationship to your point values — a ladder of 4/6/8/10 means something completely different if a no-call-no-show is worth 3 points rather than 1. How to set the ladder so it fires when you actually intend it to is a policy-design question, and it is worth answering before anybody is sitting across the desk from you.
The Thing Worth Remembering
Every number in a leave tracker should be a formula. The moment one balance is typed by hand, the file stops being a record and becomes an opinion — and the disagreement you have three months later is not about the vacation, it is about the spreadsheet.
Accrue per hour worked and part-time and mid-year hires solve themselves. Derive balances from an approved-request log and nothing drifts. Expire points on a rolling window with a real date formula and the total is right on days nobody touched it. Flag protected leave as zero and the riskiest failure mode becomes a checkbox.
That is four decisions, made once, and after that the tracker maintains itself.
Featured on ReadySheetGo
Employee PTO, Attendance & Absence Point Tracker — $18.99
Nine ready-built tabs with 250+ formulas already written and tested, and a full worked example of twelve employees pre-filled so you can see it running before you type anything.
A Settings tab holds your company details, the as-of date, your editable point values and your four disciplinary thresholds — and the entire workbook reads from it, so changing a point value re-scores every employee at once. The Employee Roster holds your people, wages, hire dates and annual PTO, sick and personal entitlements. Time-Off Requests logs every request with approved / pending / denied status and a running balance-after preview for that leave type, so you can see what approving Friday actually costs before you approve it.
The Attendance Points tab is the incident log, and it is the reason this file exists: point values auto-fill from your Settings, and old or excused points expire to zero on their own on a rolling twelve-month window you control — the most error-prone part of any attendance policy, automated. PTO Balances returns accrued, taken and remaining for all three leave types for every employee, with accrual prorating from the hire date. The Absence Calendar is an incident heatmap by employee and month, so patterns surface without anyone hunting for them. The Dashboard returns active points, who is over a threshold, PTO taken, estimated absence cost and your absenteeism rate. Employee Summary prints a full single-employee record for the HR file or a 1:1.
Verbal, written, final and termination-review flags fire automatically as points accumulate. Absence cost is calculated at each person’s own wage rate. Nothing is password-locked — every formula is visible and editable. Works in Excel, Google Sheets and Apple Numbers. No macros, no add-ons, no per-seat subscription.
Get the Employee PTO, Attendance & Absence Point Tracker →
Frequently Asked Questions
What does an employee PTO tracker actually need to hold?
Six things per person and the rest is decoration: hire date, hourly wage, hours worked in the period, the annual entitlement for each leave type, every approved request with its hours, and every attendance incident with its date. From those six, a sheet can return accrued hours, hours taken, remaining balance, a separate balance for sick and personal, active attendance points on a rolling window, and the cash cost of unscheduled absence. A grid of names with a single 'days left' column typed in by hand is a note, not a tracker, because nothing in it recalculates when somebody works a short week.
Should sick leave and PTO be tracked in the same balance?
Track them as separate columns even if your policy pools them, because the two behave differently and you will eventually need them apart. Sick leave in many states carries its own accrual rate, its own carryover rules and its own rules about what you may ask for as proof, and paid-sick-leave law applies in some places where a general PTO policy is entirely voluntary. Merging them into one number makes it impossible to answer 'how much protected sick time does this person have left' without re-deriving it from the request log. Two columns cost you nothing; one column costs you an audit.
How do I handle a PTO balance that goes negative?
Decide in advance whether you allow it, then let the sheet show it rather than clamping it to zero. An employee who takes 24 hours in March having accrued 20 is at minus 4, which is a real fact about your payroll — they have been paid for time they have not yet earned, and if they leave in April, most policies treat that as recoverable from the final cheque only where state law and a signed agreement permit it. Hiding the negative behind a MAX(0, ...) makes the balance column look tidy and makes the liability invisible.
Can a spreadsheet replace HR software for time off?
For a team of roughly three to forty people, usually yes, because the hard part of leave tracking is arithmetic — accrual per hour worked, prorating a mid-year hire, expiring attendance points on a rolling window, carryover caps — and arithmetic is exactly what a spreadsheet does well. What a sheet cannot do is let staff submit a request from their phone, sync to a payroll provider, or enforce an approval chain. If the friction you feel is administrative routing, buy software. If the friction is that nobody can agree what the balance is, the sheet fixes the actual problem for a fraction of the cost.