Trading Journal vs Broker Statement: What Your P&L Hides
The argument against keeping a journal is a reasonable one. Your broker already records every fill, to the cent, with timestamps, and hands you a statement you couldn’t produce more accurately yourself. Re-typing it into a spreadsheet looks like busywork.
It would be, if the question were what happened. The statement wins that one outright and the journal shouldn’t try to compete — for tax purposes, the year-end statement is the authoritative document and nothing in a spreadsheet overrides it.
The journal exists for a different question: what should I stop doing? And that question turns out to need fields your broker was never in a position to collect.
The Six Questions
| Question | Broker statement | Trading journal |
|---|---|---|
| What did I make? | Yes, definitively | Yes, should reconcile |
| Which setups make money? | No | Yes |
| What is one trade of this kind worth? | No | Yes |
| Are my losses finishing where I planned? | No | Yes |
| What do my rule-breaks cost? | No | Yes |
| Am I over-trading a losing idea? | No | Yes |
Five of the six come down to one thing: the broker recorded the execution and has no idea about the intention. It saw you buy 200 shares. It did not see you decide, before you bought them, that you were trading a pullback with a stop at $46.70 and that you’d risk no more than 1% on it.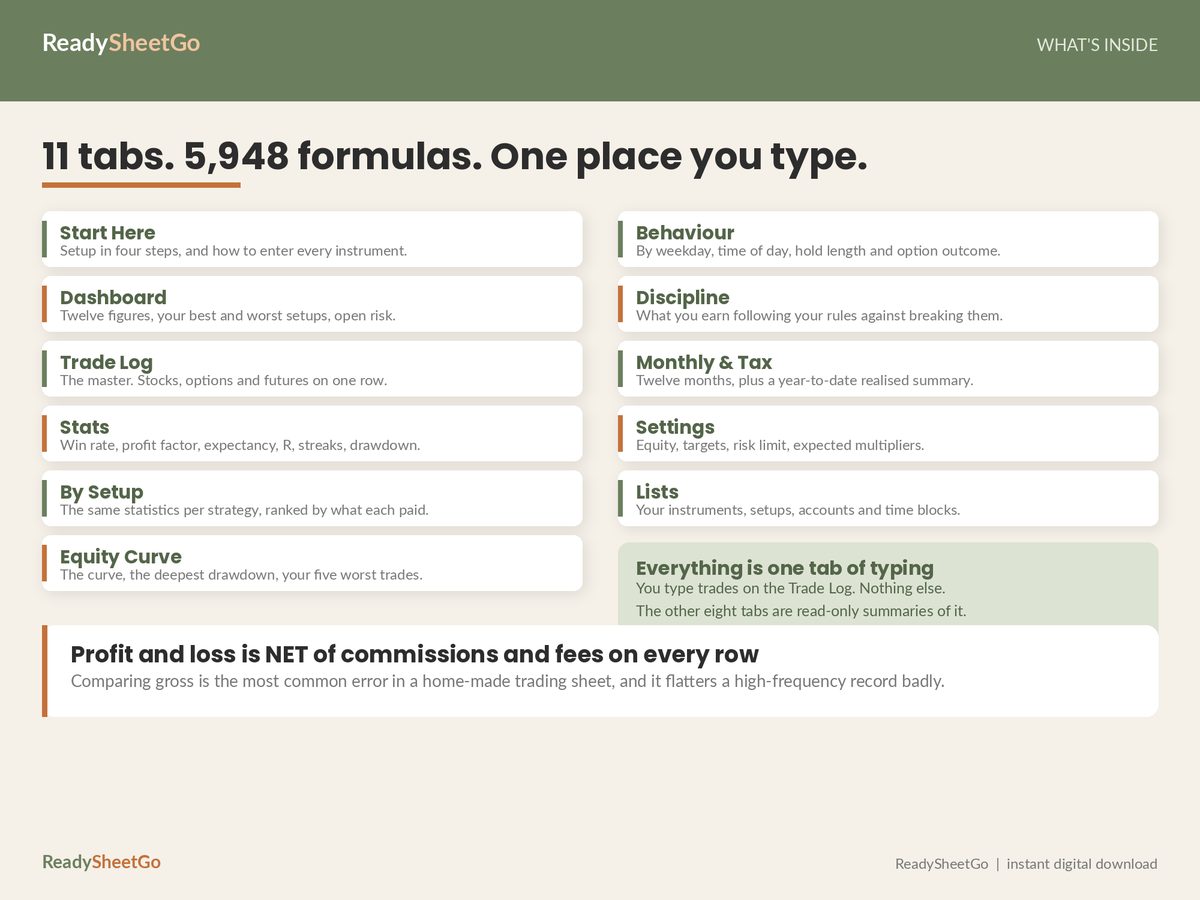
Those three facts — setup, planned stop, intended size — are the entire difference, and none of them can be recovered afterwards from any export. They’re the core of the field list a trading journal spreadsheet actually needs.
What the Blended Number Averages Away
Here’s the top line of a worked account, illustrative figures from the Options, Stock & Futures Trading Journal sample data.
Net P&L after fees: $3,455.53 across 51 closed trades. Win rate 62.7%.
Every figure there is something a good statement can give you. Every figure there is also an average across nine different things being done for nine different reasons.
Split by setup:
| Setup | Trades | Win rate | Per trade |
|---|---|---|---|
| Pullback to MA | 6 | 83.3% | +$371.09 |
| Breakout | 7 | 57.1% | +$165.86 |
| Trend Continuation | 5 | 60.0% | +$142.62 |
| Earnings Play | 5 | 40.0% | +$24.84 |
| Credit Spread | 7 | 71.4% | −$7.87 |
| Gap and Go | 6 | 50.0% | −$8.93 |
| News Catalyst | 4 | 25.0% | −$619.26 |
The 62.7% headline win rate is an average of a setup that wins 83% of the time and a setup that wins 25% of the time. It describes neither. It doesn’t describe anything that exists.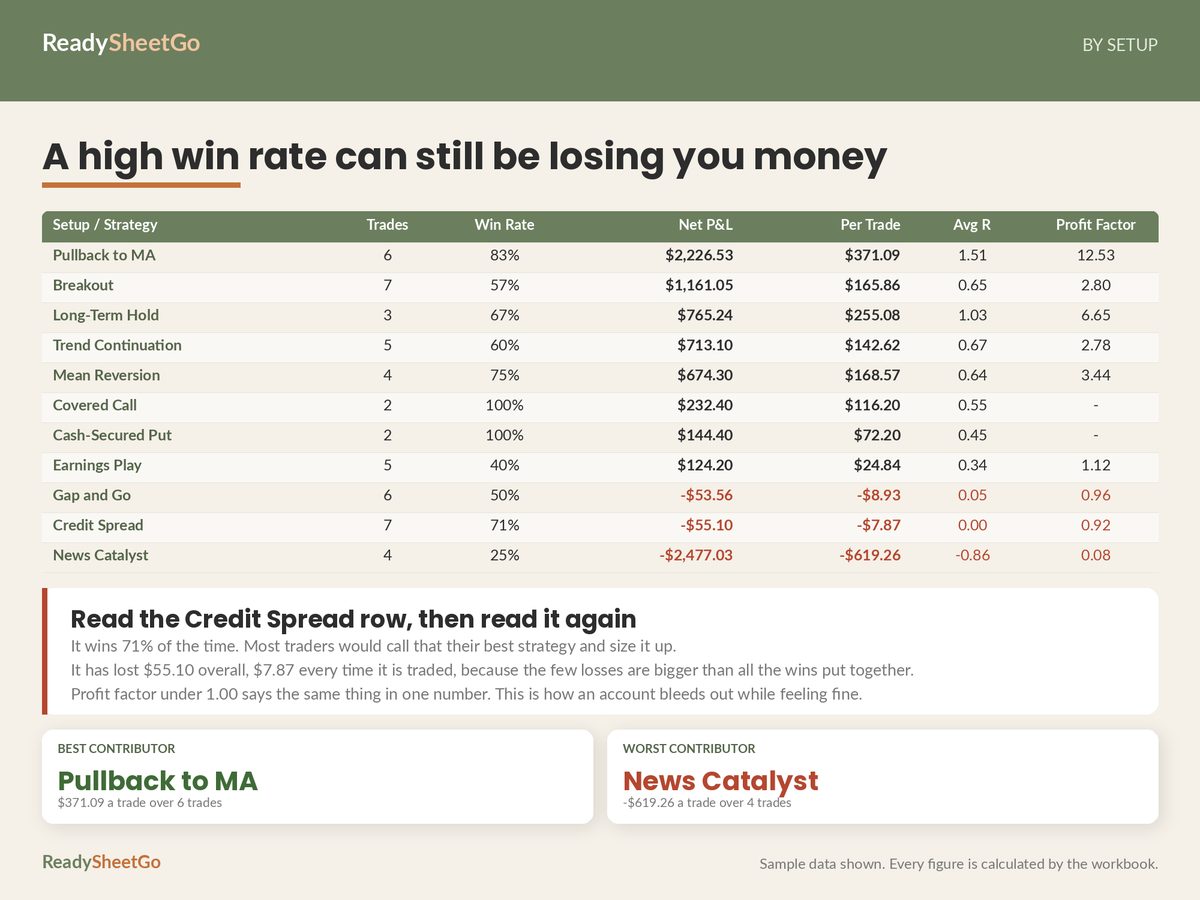
And notice the Credit Spread row, which is the reason win rate on its own is a trap: 71.4% winners and it loses money. Five small wins, two larger losses, minus $7.87 every time it’s traded. On a statement it’s a column of mostly-green rows adding to a small negative you’d never look at twice. Sorted by win rate it’s the second-best thing in the account.
There is no rearrangement of broker data that produces this table, because the broker has no column called “setup.” You can’t group by a field nobody recorded.
The Cost of Being Right in the Wrong Order
Two more things the worked account contains that a statement structurally cannot.
Average loss R: −1.06. Every trade’s result divided by the risk that was planned for it. A loss taken at the stop is −1.00R by definition, so −1.06 means losses are finishing about 6% past the exit that had already been decided on. Across 19 losses that’s about $428 — real money, spent entirely after the decision to get out had been made. The statement shows 19 losses totalling $7,557 and cannot say which part of that was the plan and which part was the overshoot, because it never knew the plan. The arithmetic behind R-multiples is a spoke of its own.
Plan adherence: 86.3%. Seven trades out of 51 where the trader didn’t take the stop they planned or didn’t size it the way they meant to. Grouping results by that one column puts the gap at $660.69 per trade between the rule-followed set and the rule-broken set.
Seven trades. That’s the largest single recoverable number in the file, it required no change of strategy to capture, and it came from two yes/no dropdowns that the broker had no way of asking.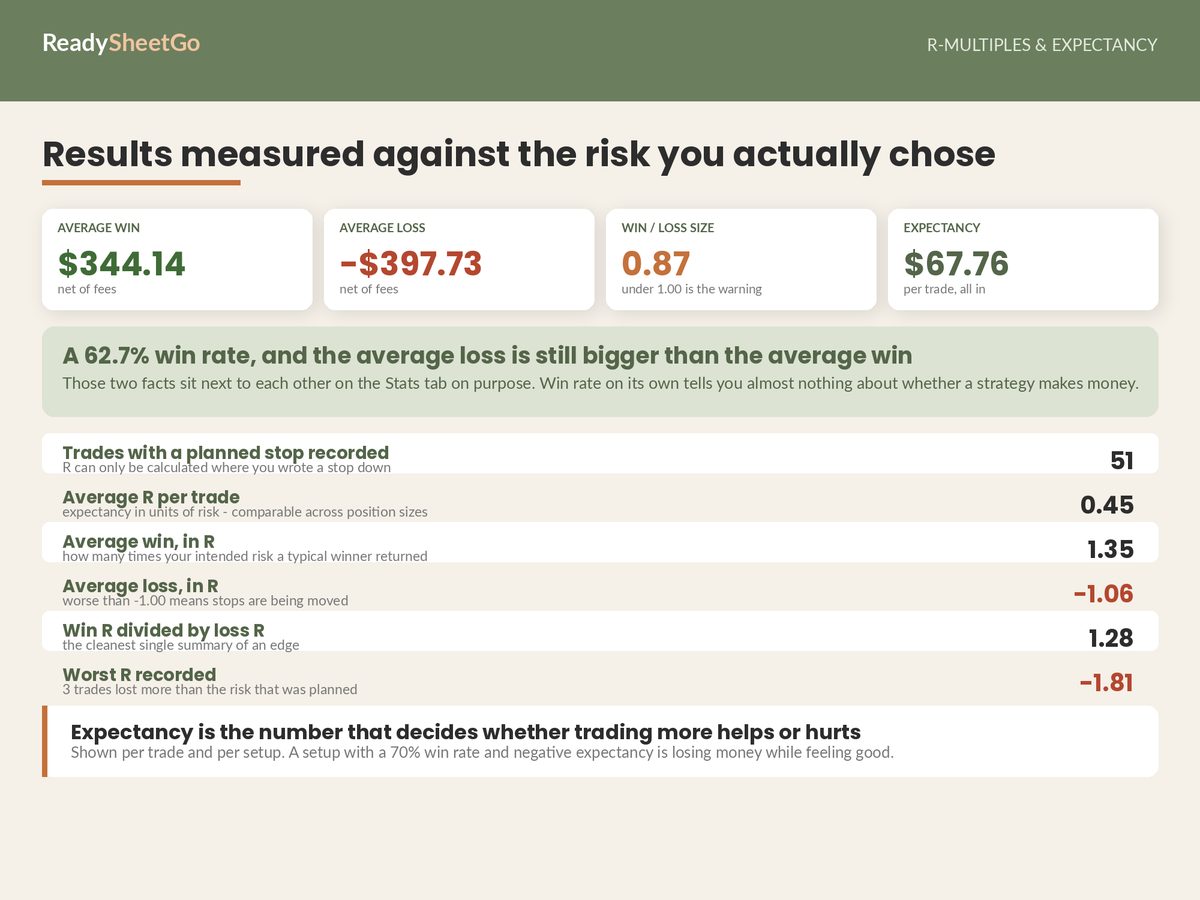
Where the Statement Wins
Three places the journal should defer, and a journal that pretends otherwise is worse than useless.
Money. Fills, fees, dividends, corporate actions, margin interest, assignments. The statement is right and your sheet is a copy. Reconcile to it monthly; when they disagree, the statement is correct.
Tax. Wash-sale adjustments, the special treatment regulated futures contracts receive in some jurisdictions, cost-basis adjustments on assigned or exercised options — a journal’s year-to-date realised summary is a document to hand to whoever prepares your return, not a calculation to file from. Anything tax-related goes to a qualified preparer with the broker’s year-end statement attached.
Positions. What you currently hold, at what price, with what margin. Live and authoritative at the broker; stale in a spreadsheet the moment you close the file.
The Practical Split
Use both, with a clear division of labour.
- At entry, type the intent: setup name, planned stop, intended size, time block. Four fields, maybe fifteen seconds, and they’re unrecoverable if you skip them. This is the only part that has to happen in the moment.
- At exit, type the outcome and the two honest questions: did you take the stop you planned, did you size it the way you meant to.
- Monthly, reconcile the mechanical columns against the export: dates, prices, quantities, fees. Catches typos, and typos in a 200-row sheet are invisible and corrupt every average downstream.
- Quarterly, read the per-setup table and act on the lines that are clearly negative — with enough closed trades behind each one to believe it. Four trades is not a finding.
The statement tells you the score. The journal tells you which plays to stop calling. You want both, and you only have to build one of them.
Featured on ReadySheetGo
Options, Stock & Futures Trading Journal — built to sit alongside your statement rather than replace it. You type the mechanical record once and the intent columns your broker never saw: setup, planned stop, intended size, time block, and two rule-adherence questions per row. The By Setup tab then produces the per-strategy table above — trades, win rate, profit factor, net and per-trade expectancy, ranked by what each setup actually contributed — while the Discipline tab prices your rule-breaks and the Stats tab tracks average loss R against the −1.00 floor. Every figure net of commissions and fees. A Row Check column catches reversed dates, zero quantities, mismatched contract multipliers and positions over your own risk limit before they reach an average. 11 tabs, 5,948 formulas, Excel and Google Sheets. Instant digital download — $17.99.
Illustrative figures only, from sample data. A journal is a record-keeping and review tool, not financial, investment or tax advice; your broker’s year-end statement is the authoritative document for tax.
Frequently Asked Questions
Why keep a trading journal if my broker already has all my trades?
Because the broker only holds what happened, not what you intended. It has no record of the stop you planned, the setup you thought you were trading, or whether you followed your own sizing rule — and those three fields are what turn a list of fills into an answer about what to stop doing. The statement is the authoritative record of the money; the journal is the only record of the decisions.
Can I just export my broker's trade history into a spreadsheet?
Yes, and it's a good starting point for the mechanical columns — dates, prices, quantities, fees. What no export contains is your planned stop, your setup name, your time block, or your rule-adherence answers, because your broker never saw them. Expect to add those by hand at entry. A useful pattern is to type the intent columns when you open the trade and reconcile the mechanical ones against the export monthly.
Does my broker's win rate figure mean anything?
Only if you trade one strategy. A blended win rate across every setup you run averages a strategy that wins 83% with one that wins 25%, and the result describes neither. Win rate is only actionable broken down by setup, which requires a setup column your broker doesn't have.
Which is the authoritative record for taxes, the journal or the statement?
The broker's year-end statement, always. A journal is a review tool — it won't apply wash-sale rules, won't handle the special treatment regulated futures contracts receive in some jurisdictions, and won't adjust cost basis for assigned or exercised options. Use the journal to decide what to trade and the statement to file. Confirm anything tax-related with a qualified preparer.