Prop Firm Challenge Tracker: Logging Drawdown and Daily Loss
Most evaluations aren’t failed on the profit target. They’re failed on a rule the trader knew, could recite, and wasn’t watching on the afternoon it mattered.
The reason is structural. A challenge asks you to satisfy three constraints simultaneously, two of which run in the opposite direction from the one you’re thinking about. You’re focused on the target. The account is quietly measuring how far you are from a floor, and separately measuring how much you’ve lost since the session opened.
A journal that already computes equity, peak equity and drawdown is most of the way there. Here’s the rest, worked on a $50,000 evaluation.
The Three Numbers
Rules vary by firm and by programme, and they change — the figures below are illustrative assumptions for the worked example, not a description of any particular provider. Read your own agreement and put your own numbers in the cells.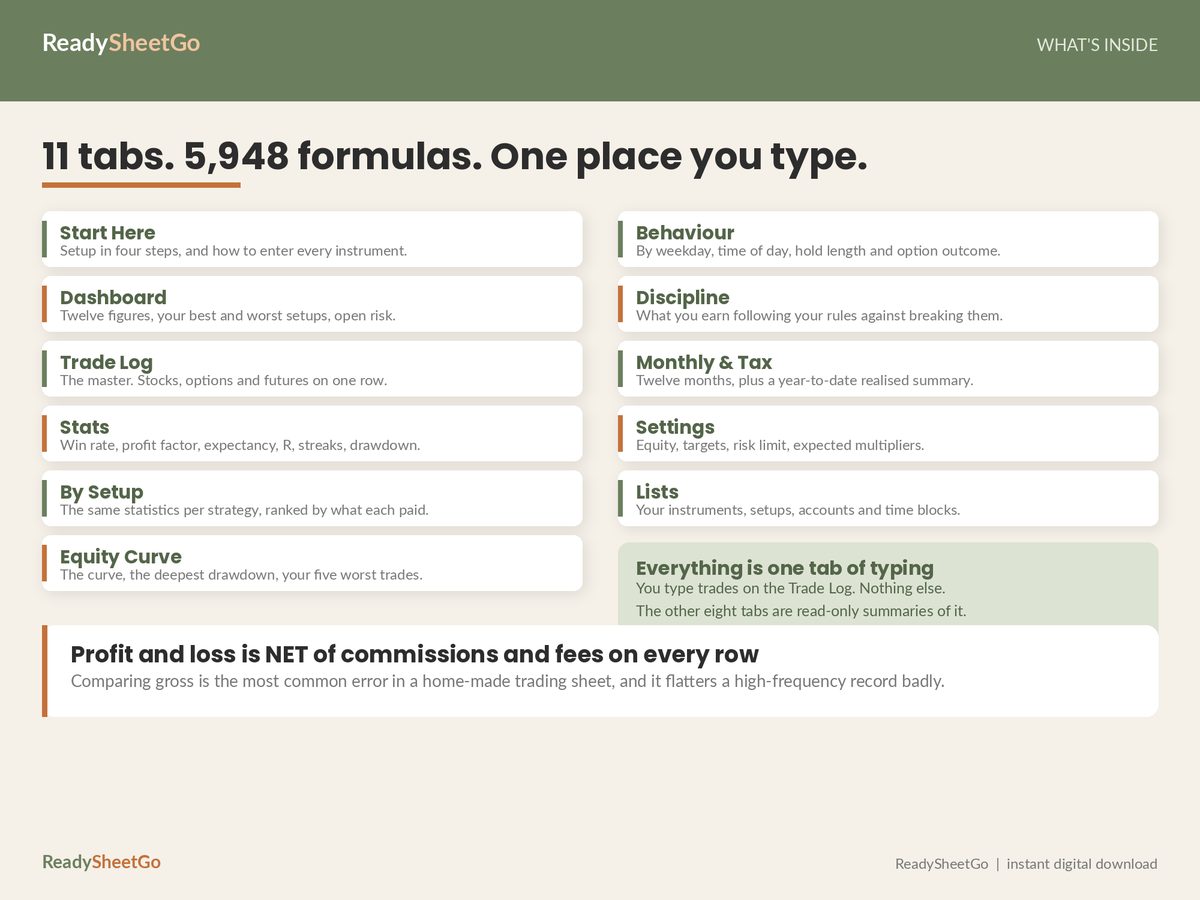
Assume:
| Parameter | Value |
|---|---|
| Starting balance | $50,000 |
| Profit target | 8% = $4,000 |
| Maximum drawdown | 10% = $5,000 |
| Daily loss limit | 5% = $2,500 |
Three derived figures, and they need to be on screen together:
- Distance to target: $4,000 − current profit
- Distance to floor: current equity − drawdown floor
- Room left today: $2,500 − today’s realised loss
The third is the one that ends challenges, because it’s the only one that resets. Your drawdown floor is a slow, visible thing you can watch approach over weeks. The daily limit is fully restored every morning and can be consumed in ninety minutes, which makes it the constraint you are least practised at feeling.
Static or Trailing: Settle This First
Before any position size is calculated, establish which kind of floor you’re trading against. It changes everything downstream.
Static. The floor is computed once from the starting balance and never moves. $50,000 with a 10% limit means $45,000, permanently. Make $3,000 and your usable cushion is now $8,000.
Trailing. The floor follows your highest equity. Make $3,000 and the floor rises with you — the cushion stays at $5,000 and the profit you just made is now protected by the rule rather than available to risk. Some versions trail closed equity only; some trail intraday peaks, which is materially stricter.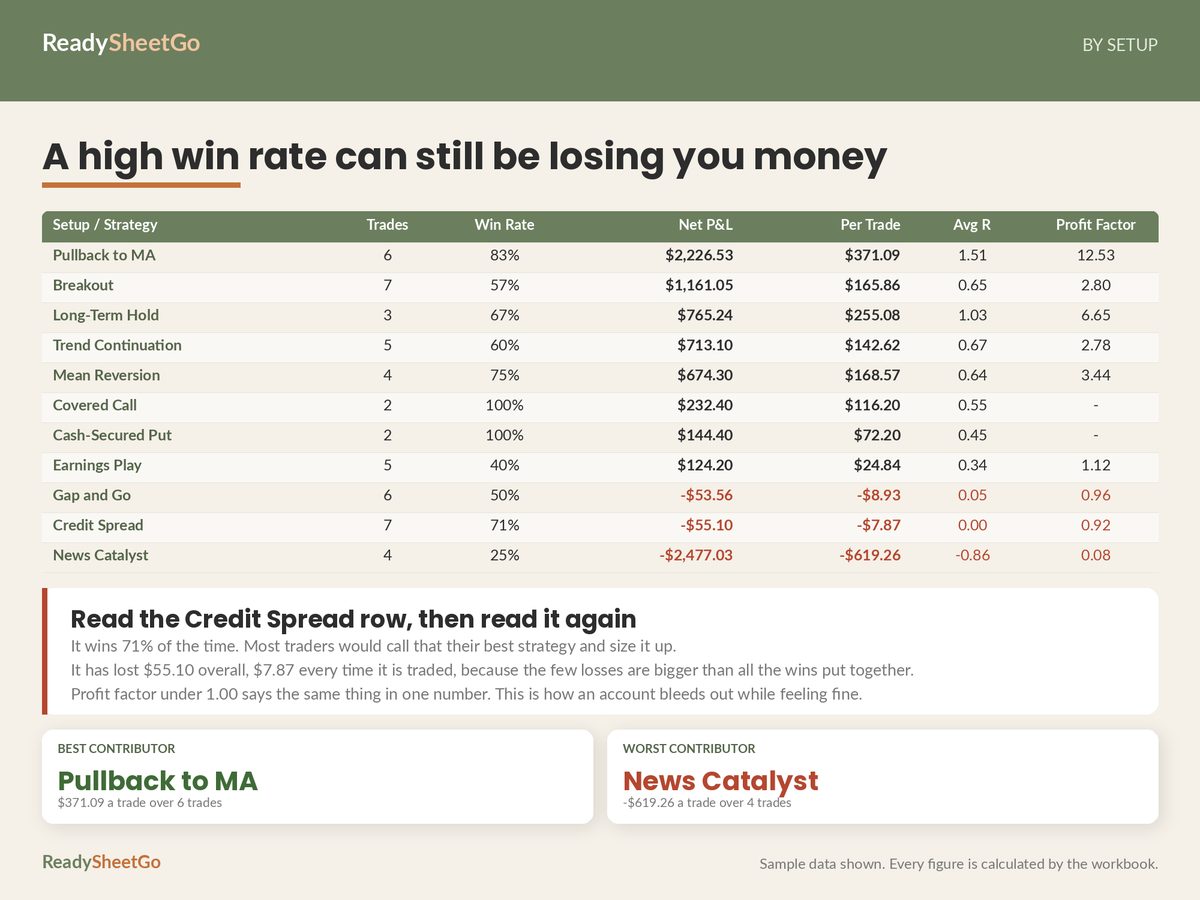
The arithmetic diverges fast:
| Equity | Static floor | Cushion | Trailing floor | Cushion |
|---|---|---|---|---|
| $50,000 | $45,000 | $5,000 | $45,000 | $5,000 |
| $52,000 | $45,000 | $7,000 | $47,000 | $5,000 |
| $53,500 | $45,000 | $8,500 | $48,500 | $5,000 |
| back to $51,000 | $45,000 | $6,000 | $48,500 | $2,500 |
Look at the last row. Same equity, same account, up $1,000 on the challenge — and under a trailing floor you have half the daily loss limit left before you breach, while the static version still has $6,000 of room. A trader who gave back $2,500 of a $3,500 run would feel fine and be one ordinary trade from failing.
In a spreadsheet the difference is one formula. Static: starting balance × (1 − limit %). Trailing: MAX(equity to date) × (1 − limit %), recomputed per row. Get the wrong one and every cushion figure in the file flatters you.
Size From the Daily Limit, Not the Account
The standard risk rule — 1% or 2% of the account — was written for an account you own, where a bad week is a setback. In an evaluation a bad session is terminal, so the binding constraint is the daily limit and that’s what position size should be derived from.
Ask the question the right way round: how many full-stop losses in a row do I need to survive today?
| Losses to survive | Max risk per trade | As % of $50,000 |
|---|---|---|
| 2 | $1,250 | 2.5% |
| 3 | $833 | 1.7% |
| 4 | $625 | 1.25% |
| 5 | $500 | 1.0% |
Three is a defensible floor and four is more comfortable. Two is not a plan — it means a single ordinary losing sequence, the kind that happens several times in any month, ends the session at the limit with no room to trade back.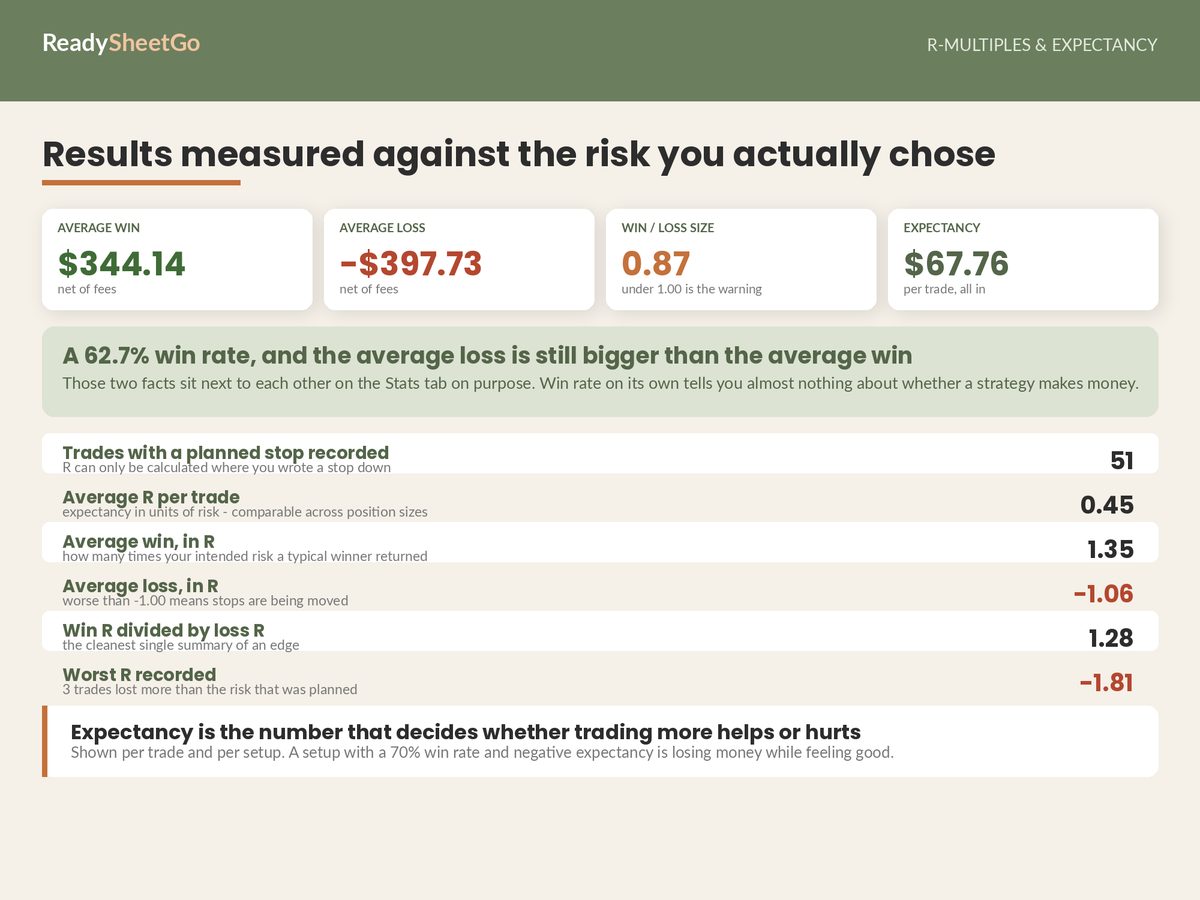
And that’s before slippage. If your losers historically finish at an average of −1.06R rather than −1.00R — which is what one worked sample record shows, and it’s a common pattern — then three “full-stop” losses actually consume about $2,650 against a $2,500 limit. You breach on the third loss having done nothing you didn’t plan. Size off your actual average loss R rather than the theoretical −1.00, and the R-multiple arithmetic is where that number comes from.
The Two Columns to Add
A journal that already holds entry, exit, planned stop, risk, net result and equity needs surprisingly little to run an evaluation.
A challenge parameters block. Six cells: starting balance, profit target %, max drawdown %, daily loss limit %, floor type (static or trailing), and minimum trading days if your programme has one. Everything else derives from these, so changing programme means changing six cells rather than rebuilding the sheet.
A daily grouping. Sum net result by trade date, and flag any date whose total goes past the limit. That’s a SUMIF on the exit-date column. The useful version of this isn’t the breach flag — it’s the worst day so far figure, which tells you how close your normal trading already runs to a rule you haven’t broken yet. A trader whose worst day is $2,180 against a $2,500 limit isn’t safe; they’ve been lucky about ordering.
Everything else you need is standard: equity after each trade, running peak equity, current drawdown, maximum drawdown, and a per-trade risk column with a flag when a position exceeds the limit you set yourself. Those already exist in any journal built around R-multiples.
What Actually Fails Evaluations
The rules are arithmetic and arithmetic is easy to satisfy. What ends challenges is execution, and this is where a journal earns its place over a rules calculator.
Two columns, filled honestly on every row: did you take the stop you planned, and did you size it the way you meant to.
In the Options, Stock & Futures Trading Journal worked sample record, plan adherence runs at 86.3% — seven rule-breaks in 51 trades — and the gap between rule-followed and rule-broken results comes to $660.69 per trade. In a personal account that’s an expensive habit you can afford to fix slowly. In a $50,000 evaluation with a $2,500 daily limit, three or four trades of that size is the entire session.
The same record’s longest losing run is 2 and its deepest drawdown is 7.81% — which, against a 10% limit, would have passed with about two percentage points to spare. Not comfortable. And that’s a record with 86% adherence; the version of it where the stops were widened twice is a failed challenge with the same strategy and the same setups.
So the honest ranking of what to watch during an evaluation: adherence first, position size second, strategy a distant third. The strategy you brought either has positive expectancy or it doesn’t, and six weeks of a challenge won’t change that. The execution is the part still in play.
Before the First Trade
A short checklist, all of it doable in an afternoon:
- Read the agreement and write the four parameters into the cells. Don’t work from memory or a marketing page.
- Establish static or trailing, and if trailing, whether it tracks closed equity or intraday peaks.
- Set max risk per trade from the daily limit divided by the number of consecutive losses you intend to survive — then cut it for your real average loss R, not the theoretical −1.00.
- Confirm any minimum trading day count, and any rule about holding through news or over a weekend. These are pass/fail conditions that have nothing to do with P&L and are missed surprisingly often.
- Log every trade the same day. A daily loss limit tracked from memory is not tracked.
The whole point of putting it in a sheet is that on the afternoon it matters, the number is already on screen rather than something you have to stop and work out. That’s the review discipline the main guide is built around — an evaluation just compresses the timeline.
Featured on ReadySheetGo
Options, Stock & Futures Trading Journal — a full trade-review workbook that covers most of an evaluation out of the box: a Settings tab where you enter your starting equity, your targets and the most you’re willing to risk on one trade; an Equity Curve tab charting the curve with your peak equity, deepest drawdown and five worst trades; a Stats tab with current drawdown, maximum drawdown as a percentage, longest losing run and R-multiples including average loss R against the −1.00 floor; a Discipline tab that prices what your rule-breaks have cost per trade; and a Row Check column that flags any position risking more than the limit you set yourself, before it’s logged. Add the two challenge cells and a daily grouping described above and it runs an evaluation. 11 tabs, 5,948 formulas, every figure net of fees, 51 closed sample trades to read first. Excel and Google Sheets, no macros. Instant digital download — $17.99.
Illustrative figures and assumptions only — challenge rules vary by firm and programme and change over time; your own agreement governs. This is a record-keeping and review method, not financial or investment advice. Trading involves risk of loss.
Frequently Asked Questions
What do you need to track during a prop firm challenge?
Three limits at once: distance to the profit target, distance to the maximum drawdown floor, and today's realised P&L against the daily loss limit. A normal trading journal tracks the first two by default through equity and drawdown; the daily loss limit needs a trade-date grouping you add yourself, because it resets every session and it's the rule most evaluations actually fail on.
What is the difference between static and trailing drawdown?
A static floor is set once from your starting balance and never moves — start at $50,000 with a 10% limit and the floor sits at $45,000 whatever happens. A trailing floor follows your highest equity, so profit raises the floor and giving that profit back can breach it even while you're up on the challenge overall. Trailing versions differ further in whether they track closed equity or intraday peaks. Check which one your agreement specifies before you size a single trade — the two produce very different position sizes.
How do I calculate a safe position size for a funded challenge?
Work backwards from the daily loss limit, not the account size. Decide how many consecutive full-stop losses you're willing to survive in one session — three is a reasonable floor — and divide the daily limit by that number to get maximum risk per trade. On a $2,500 daily limit that's roughly $830 per trade, which is 1.7% of a $50,000 account rather than the 2% a standard rule would suggest.
Can I use a normal trading journal spreadsheet for a prop firm evaluation?
Mostly. Equity curve, peak equity, current and maximum drawdown, per-trade risk and a risk-limit flag are all standard journal features and they cover the overall drawdown rule directly. What you add is two cells for the challenge parameters and a daily grouping for the loss limit. The journal's real value during an evaluation is the R-multiple and adherence columns, because evaluations are failed by execution far more often than by strategy.