Labor Cost Percentage of Sales: How to Calculate It Properly for a Small Business
The formula takes four seconds. Labour cost divided by revenue.
The reason so many small businesses end up with a number they cannot act on is not the arithmetic — it is that the two figures being divided are usually measured over slightly different windows, and the top one is usually missing roughly a tenth of what employing somebody actually costs.
Here is the calculation done properly, on one real week of a twelve-person schedule.
Start With the Week
This is the same made-up café used throughout this cluster. Twelve hourly staff, one week, overtime threshold at 40 hours: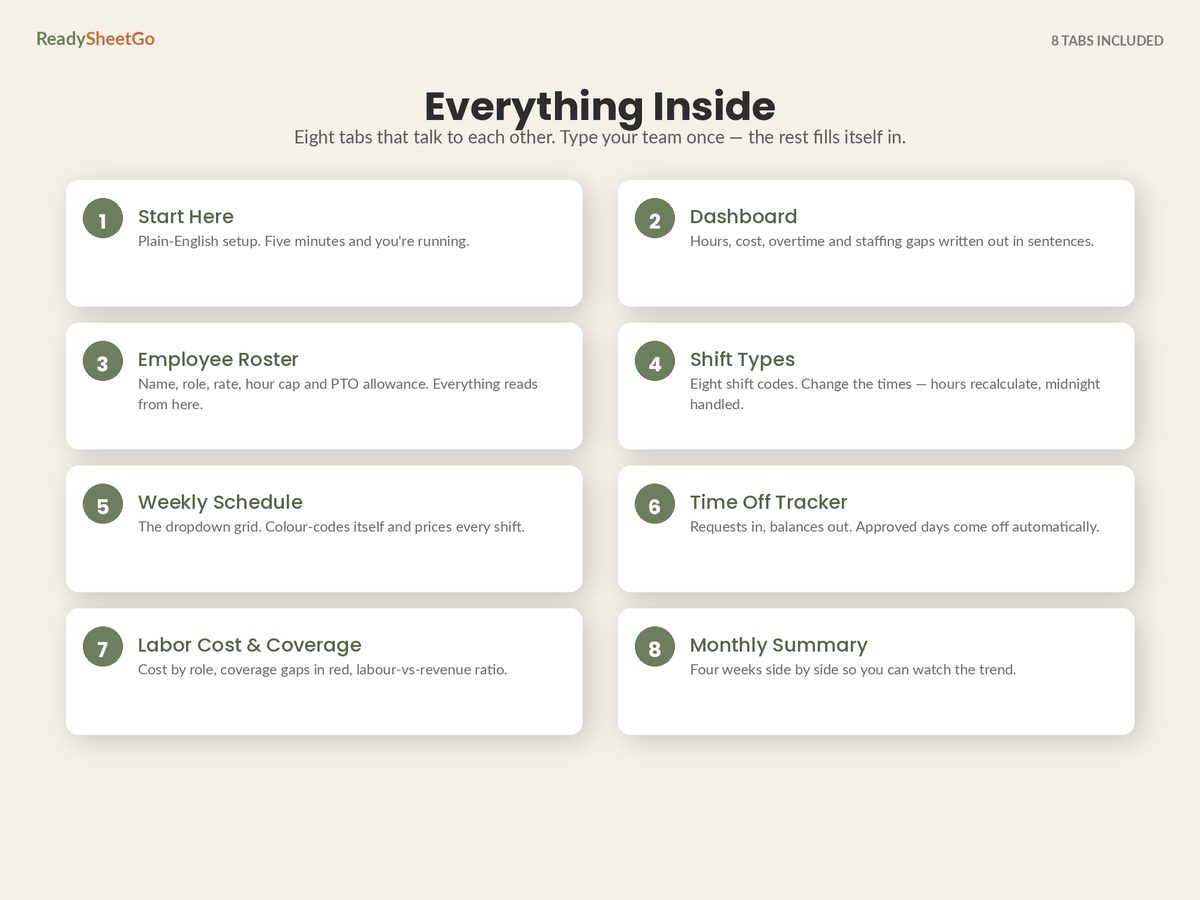
| Total hours scheduled | 339.5 |
| Of which overtime | 5.0 |
| Total wages | $6,289.63 |
| Expected revenue for the week | $22,000 |
The naive answer:
$6,289.63 ÷ $22,000 = 28.6%
That is the number most owners have in their head. It is not wrong, exactly. It is just not the cost of employing those twelve people.
What the 28.6% Leaves Out
An hour of Aisha’s time does not cost $16.50. It costs $16.50 plus everything that rides on top of a wage — and that stack is the difference between a labour percentage you can benchmark and one you cannot.
Employer payroll taxes. The employer share of Social Security and Medicare — FICA — is 7.65% of wages (6.2% plus 1.45%). This one is fixed and national, so there is no guessing involved. Note that the Social Security portion only applies up to an annual wage base per employee — a threshold high enough that it rarely binds in a small hourly business, though it can for a high-earning salaried employee.
Unemployment insurance. Federal unemployment tax plus your state’s rate. State rates vary by state, by industry and by your own claims history, so this is a number you look up on your own rate notice rather than take from an article.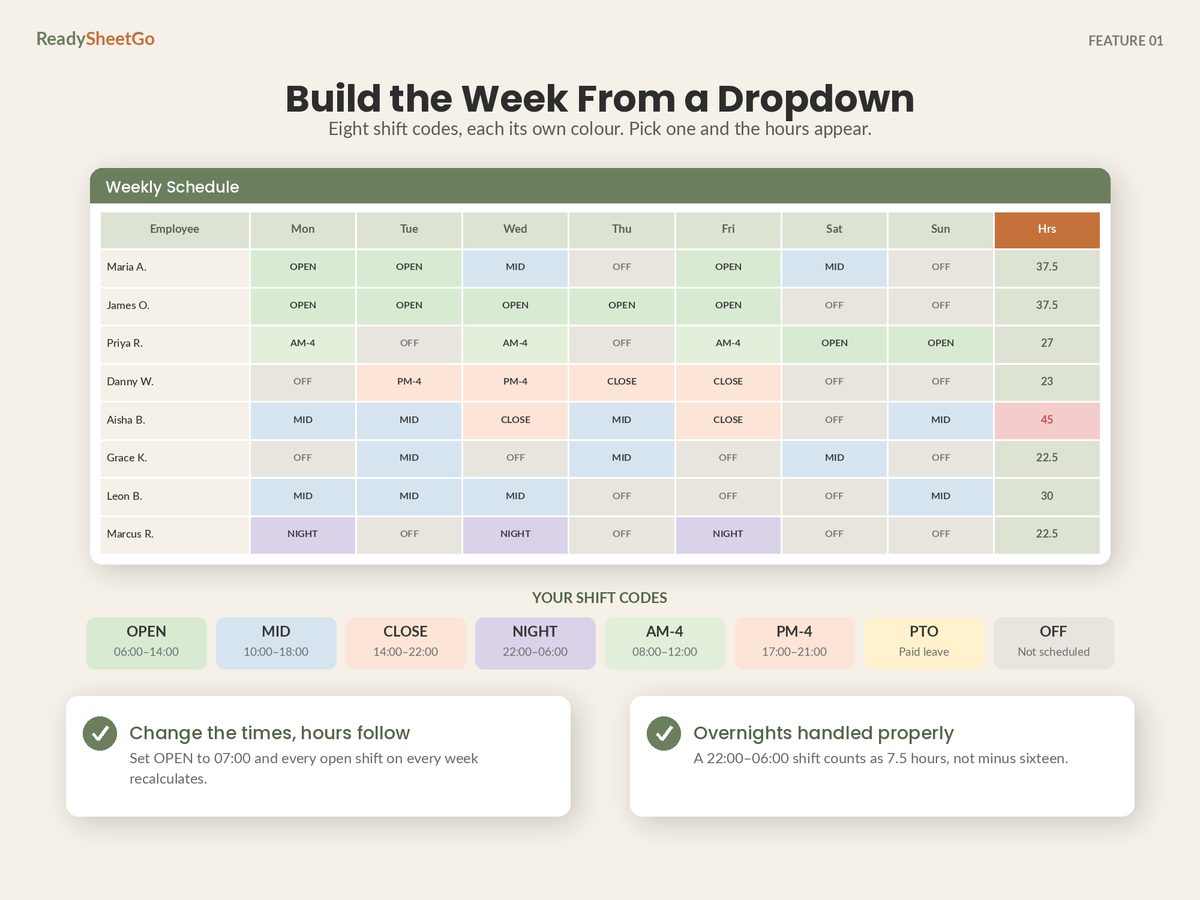
Workers’ compensation. Priced per $100 of payroll, by job classification. A kitchen classification and an office classification are not remotely the same rate, which is why a single blended assumption is only ever a placeholder.
Everything else you actually pay. Paid time off already sits inside the wage figure if PTO days are paid at contracted hours. Anything else — health contributions, uniforms, retirement match, meal allowance, training time, a scheduling app’s per-seat fee — belongs in the stack too, if you want the number to mean what you think it means.
Here is the same week with the burden added. The three percentages below are placeholders — replace them with your own rate notices, because these vary more than any other input in this calculation:
| Component | Rate applied | Amount |
|---|---|---|
| Wages | — | $6,289.63 |
| Employer FICA | 7.65% | $481.16 |
| Workers’ comp | 2.5% (placeholder) | $157.24 |
| State + federal unemployment | 2.0% (placeholder) | $125.79 |
| Fully burdened labour cost | $7,053.82 |
$7,053.82 ÷ $22,000 = 32.1%
A 3.5-point gap — and the two placeholder rates behind it are modest ones, so a business with a higher workers’ comp classification will see a wider gap than this. That is the entire reason a small business can be tracking “28%” all year, comparing it against sector advice written about burdened labour, and quietly running three and a half points hotter than it believes.
Annualised, the difference between those two numbers on this one week is $764.19 × 52 = $39,738 of real cost that the wages-only view never shows.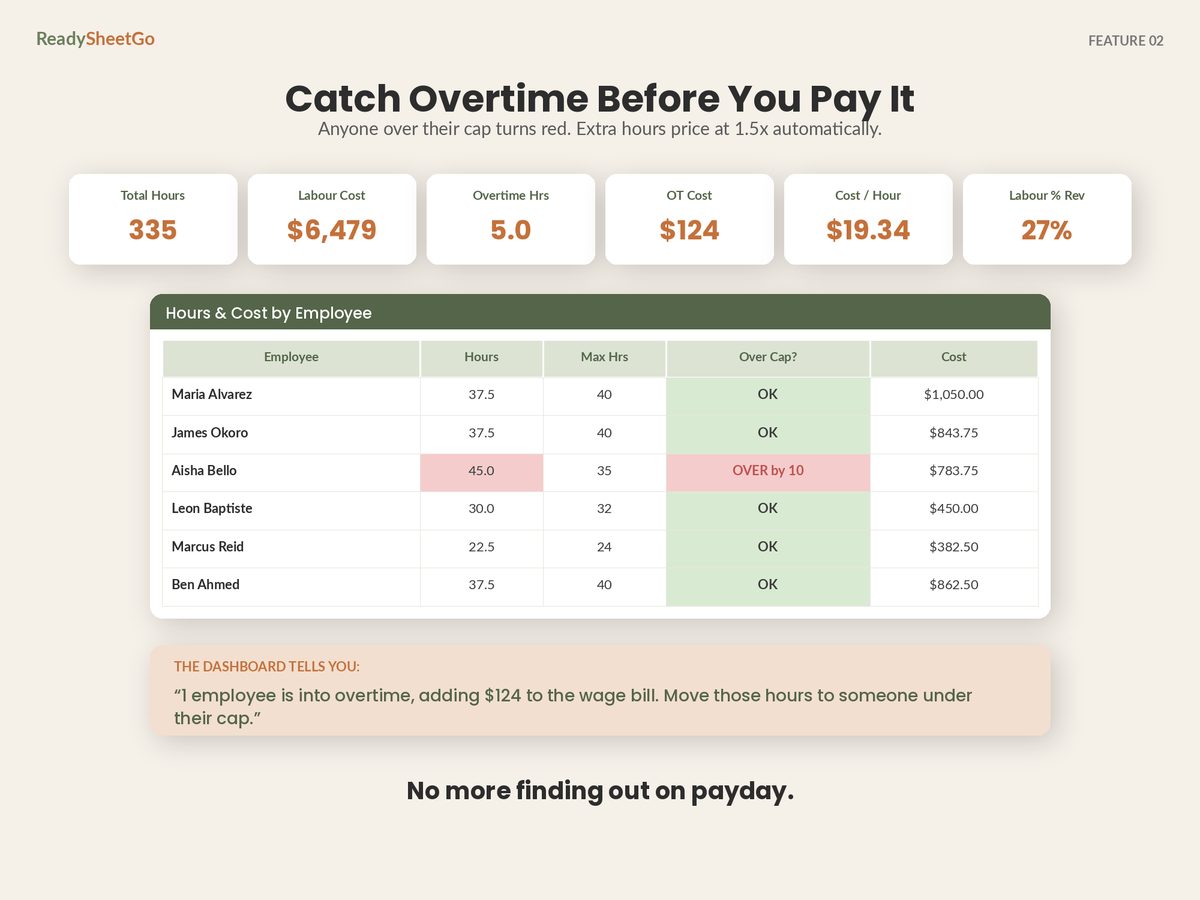
The Two Definitions, and Why You Must Pick One
There is no single correct definition. There is only consistency.
| Wages only | Fully burdened | |
|---|---|---|
| What it measures | Cash paid to staff | Total cost of employing staff |
| This week’s answer | 28.6% | 32.1% |
| Good for | Week-to-week trend, scheduling decisions | Pricing, budgeting, comparing to sector data |
| Danger | Understates true cost by several points | Slower to compute each week |
The practical arrangement most small businesses land on: track wages-only weekly because it is instant and the trend is what matters, and recalculate burdened once a quarter to keep the relationship between the two honest. If you know your burden multiplier — here, 7,053.82 ÷ 6,289.63 = 1.12 — you can convert one into the other in a single cell.
The Denominator Deserves the Same Care
Three ways the bottom of the fraction goes wrong:
Mismatched periods. The wage figure covers a schedule week; the revenue figure covers a pay period or a calendar month. If those windows differ by even a day or two, the percentage wobbles for reasons that have nothing to do with staffing. Both numbers, identical window, every time.
Gross versus net revenue. Decide whether revenue means gross sales, or sales after sales tax, refunds, discounts and third-party delivery commission. Third-party delivery commission in particular can run anywhere from around 15% to 30% of an order’s face value depending on the plan you are on, so a business including gross delivery sales in the denominator will show an artificially flattering labour percentage in exactly the weeks delivery is busiest.
Revenue you did not earn with labour. If a chunk of your takings comes from something that consumes no staff time — a vending machine, a passive rental, an online sale that ships itself — including it in the denominator makes the staffing look more efficient than it is. Either strip it out or track a second percentage for the part of the business staff actually run.
Making It a Weekly Number Rather Than a Project
The reason this rarely gets tracked is not that anyone disputes its usefulness — it is that recomputing it by hand every week is a twenty-minute chore that gets skipped in week three.
It stops being a chore when the wage figure is a by-product of building the schedule rather than something you go and fetch afterwards. If each person’s hours and rate are already in the file, the week’s cost is a total row, the burden is one multiplier, and the percentage is one division. The whole thing costs you the ten seconds it takes to type in expected revenue.
That is the design in the Employee Schedule, Shift Planner & Time-Off Tracker: you enter expected takings for the week, and the labour percentage appears next to the schedule you are still editing — which is the only moment it can change anything.
Reading the Number Once You Have It
A single week’s percentage tells you almost nothing. Four weeks side by side tell you plenty. Every figure below is wages only, tracked consistently — apply your own burden multiplier to all four if you want the burdened view:
| Hours | OT hrs | Labour cost | Revenue | Labour % | |
|---|---|---|---|---|---|
| Week 1 | 388.0 | 6.5 | $7,420.00 | $23,100 | 32.1% |
| Week 2 | 402.5 | 11.0 | $7,885.50 | $24,800 | 31.8% |
| Week 3 | 371.0 | 3.0 | $6,990.25 | $22,400 | 31.2% |
| Week 4 | 339.5 | 5.0 | $6,289.63 | $22,000 | 28.6% |
Two things to read here, and only one of them is the percentage.
The percentage is stable across weeks 1–3 — it moves less than a point while revenue moves $2,400. That is a business whose staffing scales with its trade, which is what you want.
Week 4 is not a triumph. The percentage dropped 2.6 points, and the reason is visible one column to the left: 31.5 fewer hours than week 3, on roughly the same revenue. Sometimes that is a genuine efficiency. Often it is the week you ran short-handed — the manager gap on Thursday, the second cook missing on Tuesday — and the cost of that shows up next month in service, not this month in the wage bill. A falling labour percentage always deserves the follow-up question: did we get more efficient, or did we just not cover the floor?
That is why the percentage belongs next to a coverage check rather than on its own. The full schedule spreadsheet setup puts the two in the same view for exactly this reason — and if the hours line is what keeps surprising you, catching overtime before you post the schedule is where the controllable part of it lives.
The Thing Worth Remembering
Labour cost percentage is easy to calculate and easy to calculate wrongly, in a way that flatters you by three or four points and never announces itself.
Pick a definition. Include the burden, or know your multiplier. Match the periods. Then stop comparing yourself to figures from the internet and start comparing yourself to your own median over twelve weeks — because the only benchmark that knows your rent, your trade and your rates is yours.
Featured on ReadySheetGo
Employee Schedule, Shift Planner & Time-Off Tracker — $14.99
The labour percentage is only useful if it appears while you can still change the schedule. This file puts it there.
Enter your expected weekly takings and the Labor Cost & Coverage tab returns your labour-to-revenue ratio with a straight verdict, alongside cost broken down by role and a coverage check that flags any day below the minimum headcount you set. The Weekly Schedule grid prices itself as you fill it from dropdowns — hours, overtime hours and cost per person on the right, daily totals at the bottom. Monthly Summary stacks four weeks side by side with hours, overtime, cost and labour percentage, plus a plain-English read on whether the wage bill is climbing.
Eight ready-built tabs, 460+ tested formulas, a full twelve-person sample week pre-filled, your own overtime threshold and multiplier, unlimited employees and no per-seat pricing. Works in Excel, Google Sheets and Apple Numbers. No macros, no add-ons, no subscription.
Get the Employee Schedule, Shift Planner & Time-Off Tracker →
Frequently Asked Questions
What is the formula for labor cost percentage?
Total labour cost for a period divided by total revenue for the same period, multiplied by 100. The formula is trivial; the definitions are where it goes wrong. Both numbers have to cover the identical window — a wage bill for a week that ran Monday to Sunday cannot be divided into revenue for a pay period that ran Sunday to Saturday — and you have to decide, and then stay consistent about, whether labour cost means wages only or wages plus employer payroll taxes, insurance and benefits.
What is a good labor cost percentage?
It varies so widely by trade that any single figure quoted without a sector attached is close to meaningless — a full-service restaurant, a retail shop and a cleaning company have structurally different answers, and even within one trade a business that owns its premises differs from one paying rent. The useful benchmark is your own: calculate it weekly for twelve weeks, take your own median, and treat movement away from that as the signal. A number that is stable while revenue moves is healthy; a number that climbs while revenue is flat is the thing you are watching for.
Should payroll taxes be included in labor cost percentage?
If you are using the number to make decisions about what staff really cost you, yes. The employer share of Social Security and Medicare is 7.65% of wages, and on top of that sit federal and state unemployment tax and workers' compensation insurance, which vary by state, industry and your own claims history. Wages-only is a fine number to track for trend, but it is several percentage points below the truth, so never compare a wages-only figure against a benchmark that was calculated fully burdened.
Should tips be included when calculating labor cost?
Tips paid directly by customers to staff are not your labour cost — that money never passes through your accounts as a wage expense. What does belong in the calculation is any tip you process through payroll, any service charge you distribute, and the employer payroll taxes you owe on reported tips. Getting this wrong in either direction distorts the percentage badly in tipped trades, so decide the treatment once, write it down, and apply it every week.