Dead Stock: How to Find the Products That Never Sell (and What to Do With Them)
Every alert in your inventory spreadsheet points the same direction.
Low stock. Out of stock. Reorder now. Amber, red, and a count on the dashboard. All of it watching the things that sell, which is reasonable, because the things that sell are the business.
Full walkthrough of the template used in this guide.
Nothing at all is watching this line:
| SKU | Product | Cost | On hand | Reorder pt | Status | Value @ cost | Units sold, 90 days |
|---|---|---|---|---|---|---|---|
| ORN-BRASS-STAR | Brass star ornament | $4.90 | 61 | 10 | OK | $298.90 | 0 |
Status: OK. On hand is well above the reorder point, so no alert will ever fire on it. It has also not sold a single unit in three months, and against this made-up gift shop’s $4,420 of average stock at cost, that $298.90 is 6.8% of the entire investment — permanently unavailable for buying products that people actually want.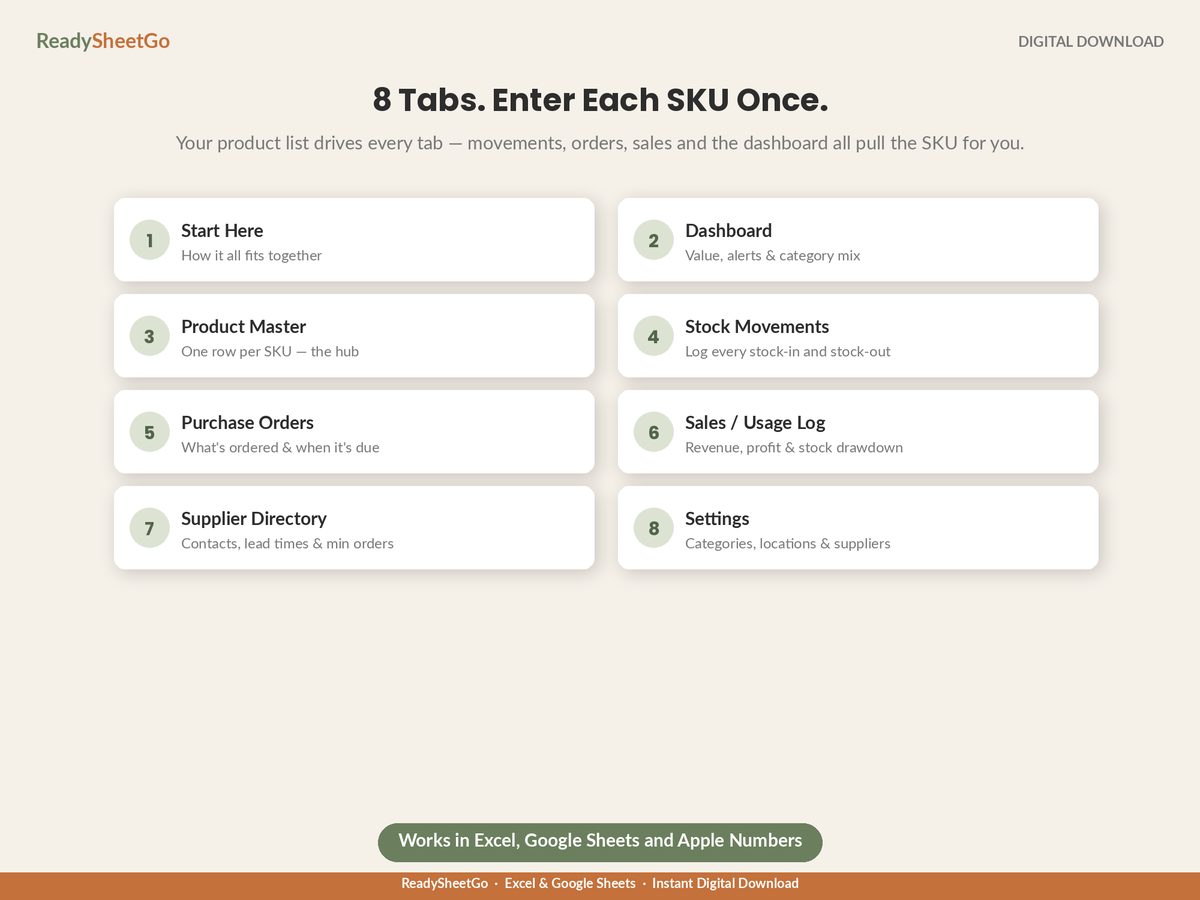
That is dead stock: not the thing that ran out, but the thing that never left. It is invisible by design, because every measure in a normal inventory sheet is a quantity measure and dead stock’s quantity never changes.
The Flag That Finds It
One column, one formula, and the problem becomes visible.
Days since last movement =
=IF(COUNTIFS(movement_sku, A2)=0, "NEVER MOVED", TODAY() - MAXIFS(movement_date, movement_sku, A2))
The COUNTIFS guard at the front is not optional, and it is the part people leave out. Without it, a SKU with no movement rows at all makes MAXIFS return zero, and TODAY() minus zero returns a number in the forty-thousands — which lands silently in your worst bucket and looks like data rather than an error. A product that has never sold once is also a genuinely different problem from one that stopped selling, so it deserves its own label. Format the cell as General, too, or Excel will inherit the date formatting from TODAY() and show you a day in 1987.
Then a status on top of it:
- 0–89 days → Active
- 90–179 days → Slow moving
- 180+ days → Dead stock
- Never moved → its own bucket, reviewed separately
Those thresholds are a working rule of thumb rather than a standard — they are simply the windows that catch the right lines in a shop with a normal selling cycle. Lengthen them if yours is slower.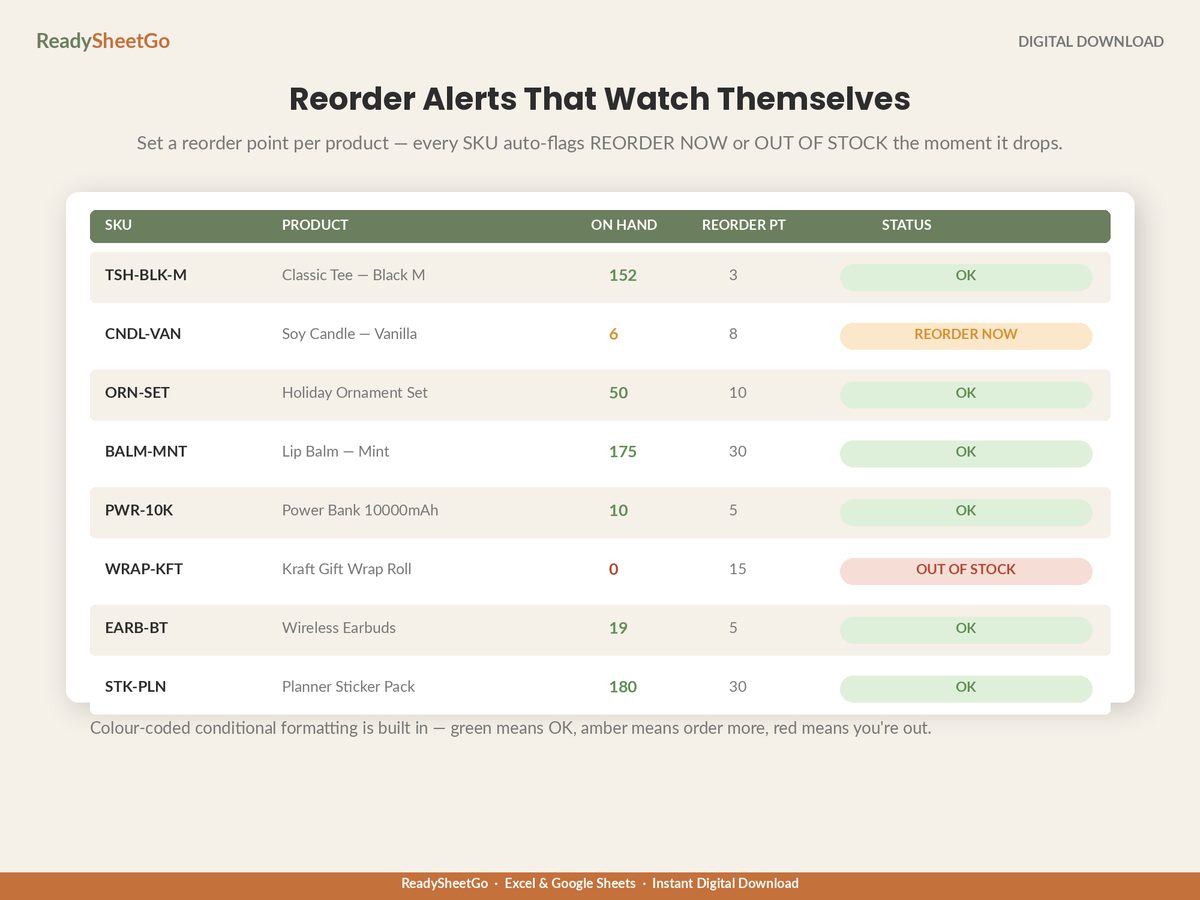
MAXIFS needs Excel 2019 or later, or Google Sheets; in older Excel and in LibreOffice it returns #NAME?. The portable fallback is =TODAY()-MAX(IF(movement_sku=A2, movement_date)) entered as an array formula (Ctrl+Shift+Enter), wrapped in the same COUNTIFS guard — or simply sort the movement log by SKU and date and read the last date per product off the bottom of each group.
Two refinements worth making straight away:
Weight it by dollars, not units. Sort your dead-stock list by value at cost, descending. Forty dead gift boxes at $1.35 is $54 and a shrug. Sixty-one dead ornaments at $4.90 is $298.90 and a decision. The unit count is the wrong ranking; the money is the right one.
Exclude genuinely seasonal lines, deliberately. Christmas stock in June has not moved for six months and is not dead. Add a “seasonal” flag on the product master and either exclude those lines from the report or measure them against the same period last year instead. Without that, the flag cries wolf every off-season and people stop reading it — which is worse than not having it.
Reading the Report: Four Kinds of Not-Selling
A dead-stock list is not a list of mistakes. It is four different situations wearing the same label, and each one has a different exit.
1. It was never going to sell. Bought on instinct, or because the supplier had a deal, or because the minimum order was 100 and you wanted 20. Nothing is wrong with the product; it simply is not what your customers come to you for. This is the group to clear fastest — waiting does not improve it.
2. It sold, then stopped. Look at the last-movement date and what happened around it. A price rise, a supplier substitution, a change in packaging, a competitor undercutting, a shift in where it sat in the shop or the listing order online. This group is often recoverable, and the fix is rarely a discount — it is usually the thing that changed.
3. It never gets seen. The product is fine and nobody encounters it. Buried on page four of the online shop, on the bottom shelf, missing photographs, a title nobody searches. Free to fix, and worth fixing before discounting a cent, because you may be about to mark down a product with a merchandising problem rather than a demand problem.
4. It is a component of something that does sell. Careful here. Gift boxes show poor turnover and would flag as slow on a naive report, but they are what candles ship in. Anything consumed rather than sold needs measuring against the thing it supports — usage, not sales — or you will clear out the packaging for your best-selling line.
Categorising the list takes about ten minutes and changes what you do with roughly half of it.
What It Actually Costs to Keep
The purchase price is the visible cost and the smallest part of it.
The real cost is what that money would otherwise be doing. In the same shop, soap turns 7.11 times a year and ceramics turn 1.68. The $298.90 stuck in brass ornaments, moved into soap, would be converting back into cash roughly every seven weeks instead of never. That is not a theoretical loss; that is the difference between a business that funds its own growth and one that keeps needing more cash to buy stock.
Then add the ordinary costs of holding it: the space, the handling every time it is moved or counted, the slow drift out of relevance, and the gradual damage that anything sitting on a shelf for two years quietly accumulates.
If you want a dollar figure, use your own assumption rather than borrowing a percentage from an article. Pick a carrying cost you can justify for your business — say 20% a year, covering space, handling and deterioration — and apply it:
$298.90 × 20% = $59.78 a year to keep stock that is producing nothing.
Your percentage may be 10% or 35% depending on whether you rent storage and how fragile the product is. The point is not precision. The point is that the ornaments have a running cost, they have had it for as long as they have been there, and nothing in the spreadsheet was charging it to them.
The Four Exits
Once the list is categorised, each line takes one of four routes. Decide which one, write it on the row, and give it a date.
1. Fix the visibility — free, and try it first. Better photographs, a clearer title, a different shelf, a spot in the online shop’s front row, a mention in a newsletter. Give it 30 days and re-check the movement date. If it moves, it was never dead. Discounting first destroys margin you did not need to give up.
2. Bundle it. Pair the dead line with a fast seller at a combined price that is attractive but does not publish a low price for the dead item on its own. The brass ornament at $18 that nobody buys goes into a gift set with two $22 candles — $62 of retail, sold at $52. That is a 16% discount rather than the 40% the markdown ladder would eventually reach, it costs you $17.70 in goods, and the customer reads it as a gift set rather than a clearance line.
3. Discount it — in steps, with an end date. Not a permanent 20% that sits there for a year. A ladder: 20% for two weeks, 40% for two weeks, then whatever clears it. Set the dates before you start, because the failure mode of discounting is a markdown that becomes the new price and never clears the stock anyway.
4. Write it off or donate it. Last resort, for stock that will not move at any price you are willing to publish. Log it as an adjustment in your movement log with the reason, so the loss appears in your records rather than evaporating out of a retyped quantity. Depending on where you are and what the item is, a donation may have a tax consequence worth asking your accountant about — that is a question for them, not for a spreadsheet.
Whichever route a line takes, record the decision and the date on the row. A dead-stock list that gets rebuilt from scratch every quarter, with the same items on it and no record of what was tried, is a report nobody acts on.
Stop Buying It Again
The report is a cure. The prevention is upstream, and it is mostly three habits.
Check the dead-stock flag before every purchase order. If a SKU is on the list, it does not get reordered, no matter how good this month’s supplier offer is. Obvious, and routinely ignored, because ordering usually happens off a low-stock list that dead lines never appear on.
Treat minimum order quantities as a real cost. A supplier minimum of 100 units on a line you sell 20 of a year is not a discount, it is a five-year commitment. The gift packaging in this shop turns 1.46 times a year — $700 of cash bought a few dollars of case discount. That trade should be made deliberately, not accepted because it is how the supplier prices.
Buy new lines in the smallest quantity you can. The first order on an untested product is a test, and the correct size for a test is small even when the per-unit price is worse. A $60 mistake teaches you the same thing a $300 mistake does.
Review the flag monthly, not annually. A line caught at 90 days can still be fixed with better photographs. A line caught at 400 days is a markdown, and the difference between those two outcomes is entirely a matter of when somebody looked.
The Thing Worth Remembering
Your inventory spreadsheet is watching everything that moves. Dead stock is defined by not moving, so it is the one thing the entire alerting system is structurally incapable of seeing.
It takes one column — days since last movement — sorted by dollars rather than units, to make it visible. What it usually shows is not a disaster but a slow leak: a handful of lines, a few hundred dollars, sitting still while the cash they represent could be turning over seven times a year in something else.
For the flag in context, alongside the reorder alerts and the two valuations it sits next to, see the full small business inventory spreadsheet setup — and for the ratio that shows which whole categories are dragging, inventory value at cost versus retail and the turnover it feeds.
Featured on ReadySheetGo
Small Business Inventory & Stock Management Tracker — $16.99
Eight ready-built tabs, every formula already written, 24 sample products pre-filled.
A dead-stock flag surfaces products sitting on the shelf that never sell — the lines no reorder alert will ever point at — while the Product Master runs live reorder-point status per SKU (OK, REORDER NOW, OUT OF STOCK) for everything that does move. Every product is valued at cost and at retail, so the dead lines are ranked by the money they are holding rather than by unit count.
The Stock Movements log records every stock-in, stock-out and adjustment with a date and a location, which is what a days-since-last-movement calculation reads from. The Dashboard returns total value at cost and retail, potential gross profit, units on hand, low-stock and out-of-stock counts, open purchase orders and inventory value by category — the split that shows which part of the shop is slow. Purchase Orders and a Supplier Directory with lead times and minimum order quantities cover the buying decisions that create dead stock in the first place.
Works in Excel, Google Sheets and Apple Numbers. No macros, no add-ons, no subscription.
Get the Small Business Inventory & Stock Management Tracker →
Frequently Asked Questions
What counts as dead stock?
Any product that has had no movement for long enough that it is no longer reasonable to expect it to sell at full price. A practical working rule — not a standard, just a window that tends to catch the right lines — is to flag anything with no movement for 90 days as slow and 180 days as genuinely dead. Adjust it for your own selling cycle: a shop with a strong seasonal pattern needs a longer window, or the flag will condemn every seasonal line during its off-season.
Why don't reorder alerts catch dead stock?
Because a reorder alert fires when quantity falls, and dead stock's quantity never falls. A product with 61 units on hand and a reorder point of 10 reads OK forever, no matter how many years it sits there. Every alert in a normal inventory sheet points at the fast movers. Finding dead stock needs a completely separate flag based on time since last movement, not quantity — which is why so many shops never see it.
Is it better to discount dead stock or write it off?
Almost always discount first, because a sale at a reduced price recovers cash and clears space, while a write-off recovers neither. The exception is stock so unsellable that the effort of discounting it costs more than it returns, or product that would damage your pricing if it appeared at a low price in front of regular customers. Bundling is the middle route: it moves the dead line without publishing a low price for it.
How much does dead stock actually cost me?
The purchase price is only the visible part. The real cost is what that money would have done in a product that sells — a line turning seven times a year converts the same cash back into cash every seven weeks. Add storage, handling and the gradual loss of condition or relevance. Rather than adopting someone else's carrying-cost percentage, apply your own assumption to your own dead-stock total and treat the result as an order of magnitude, not a precise figure.